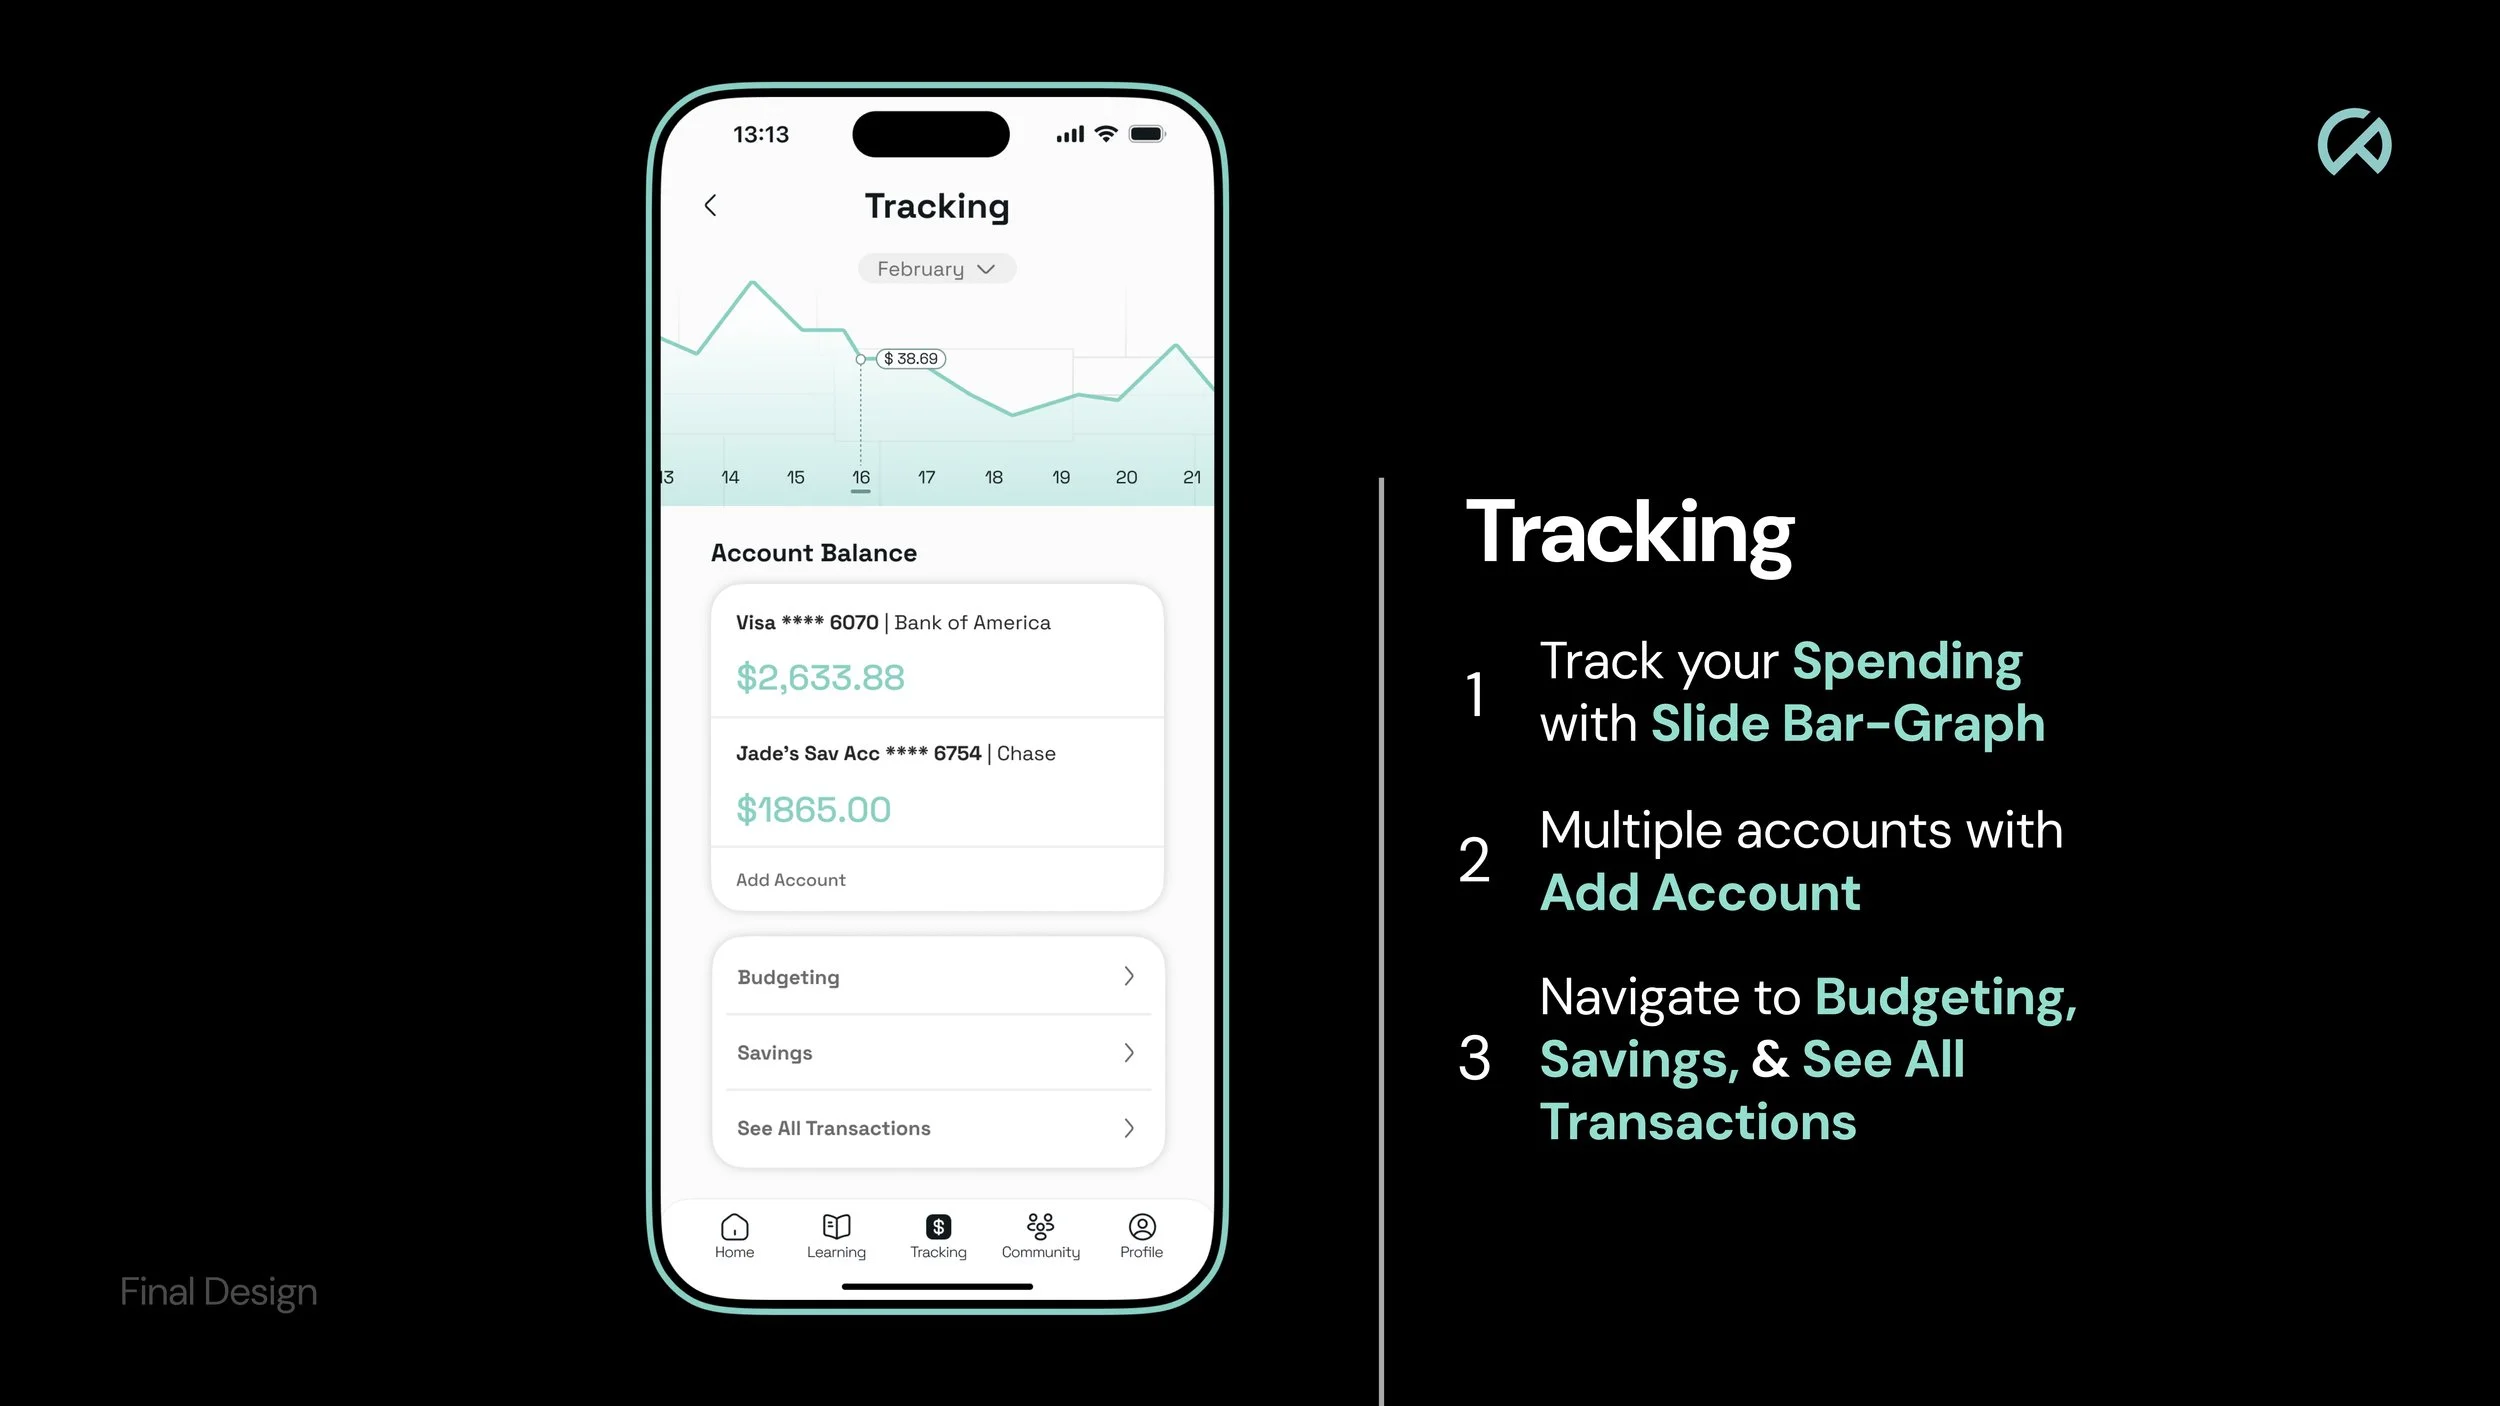
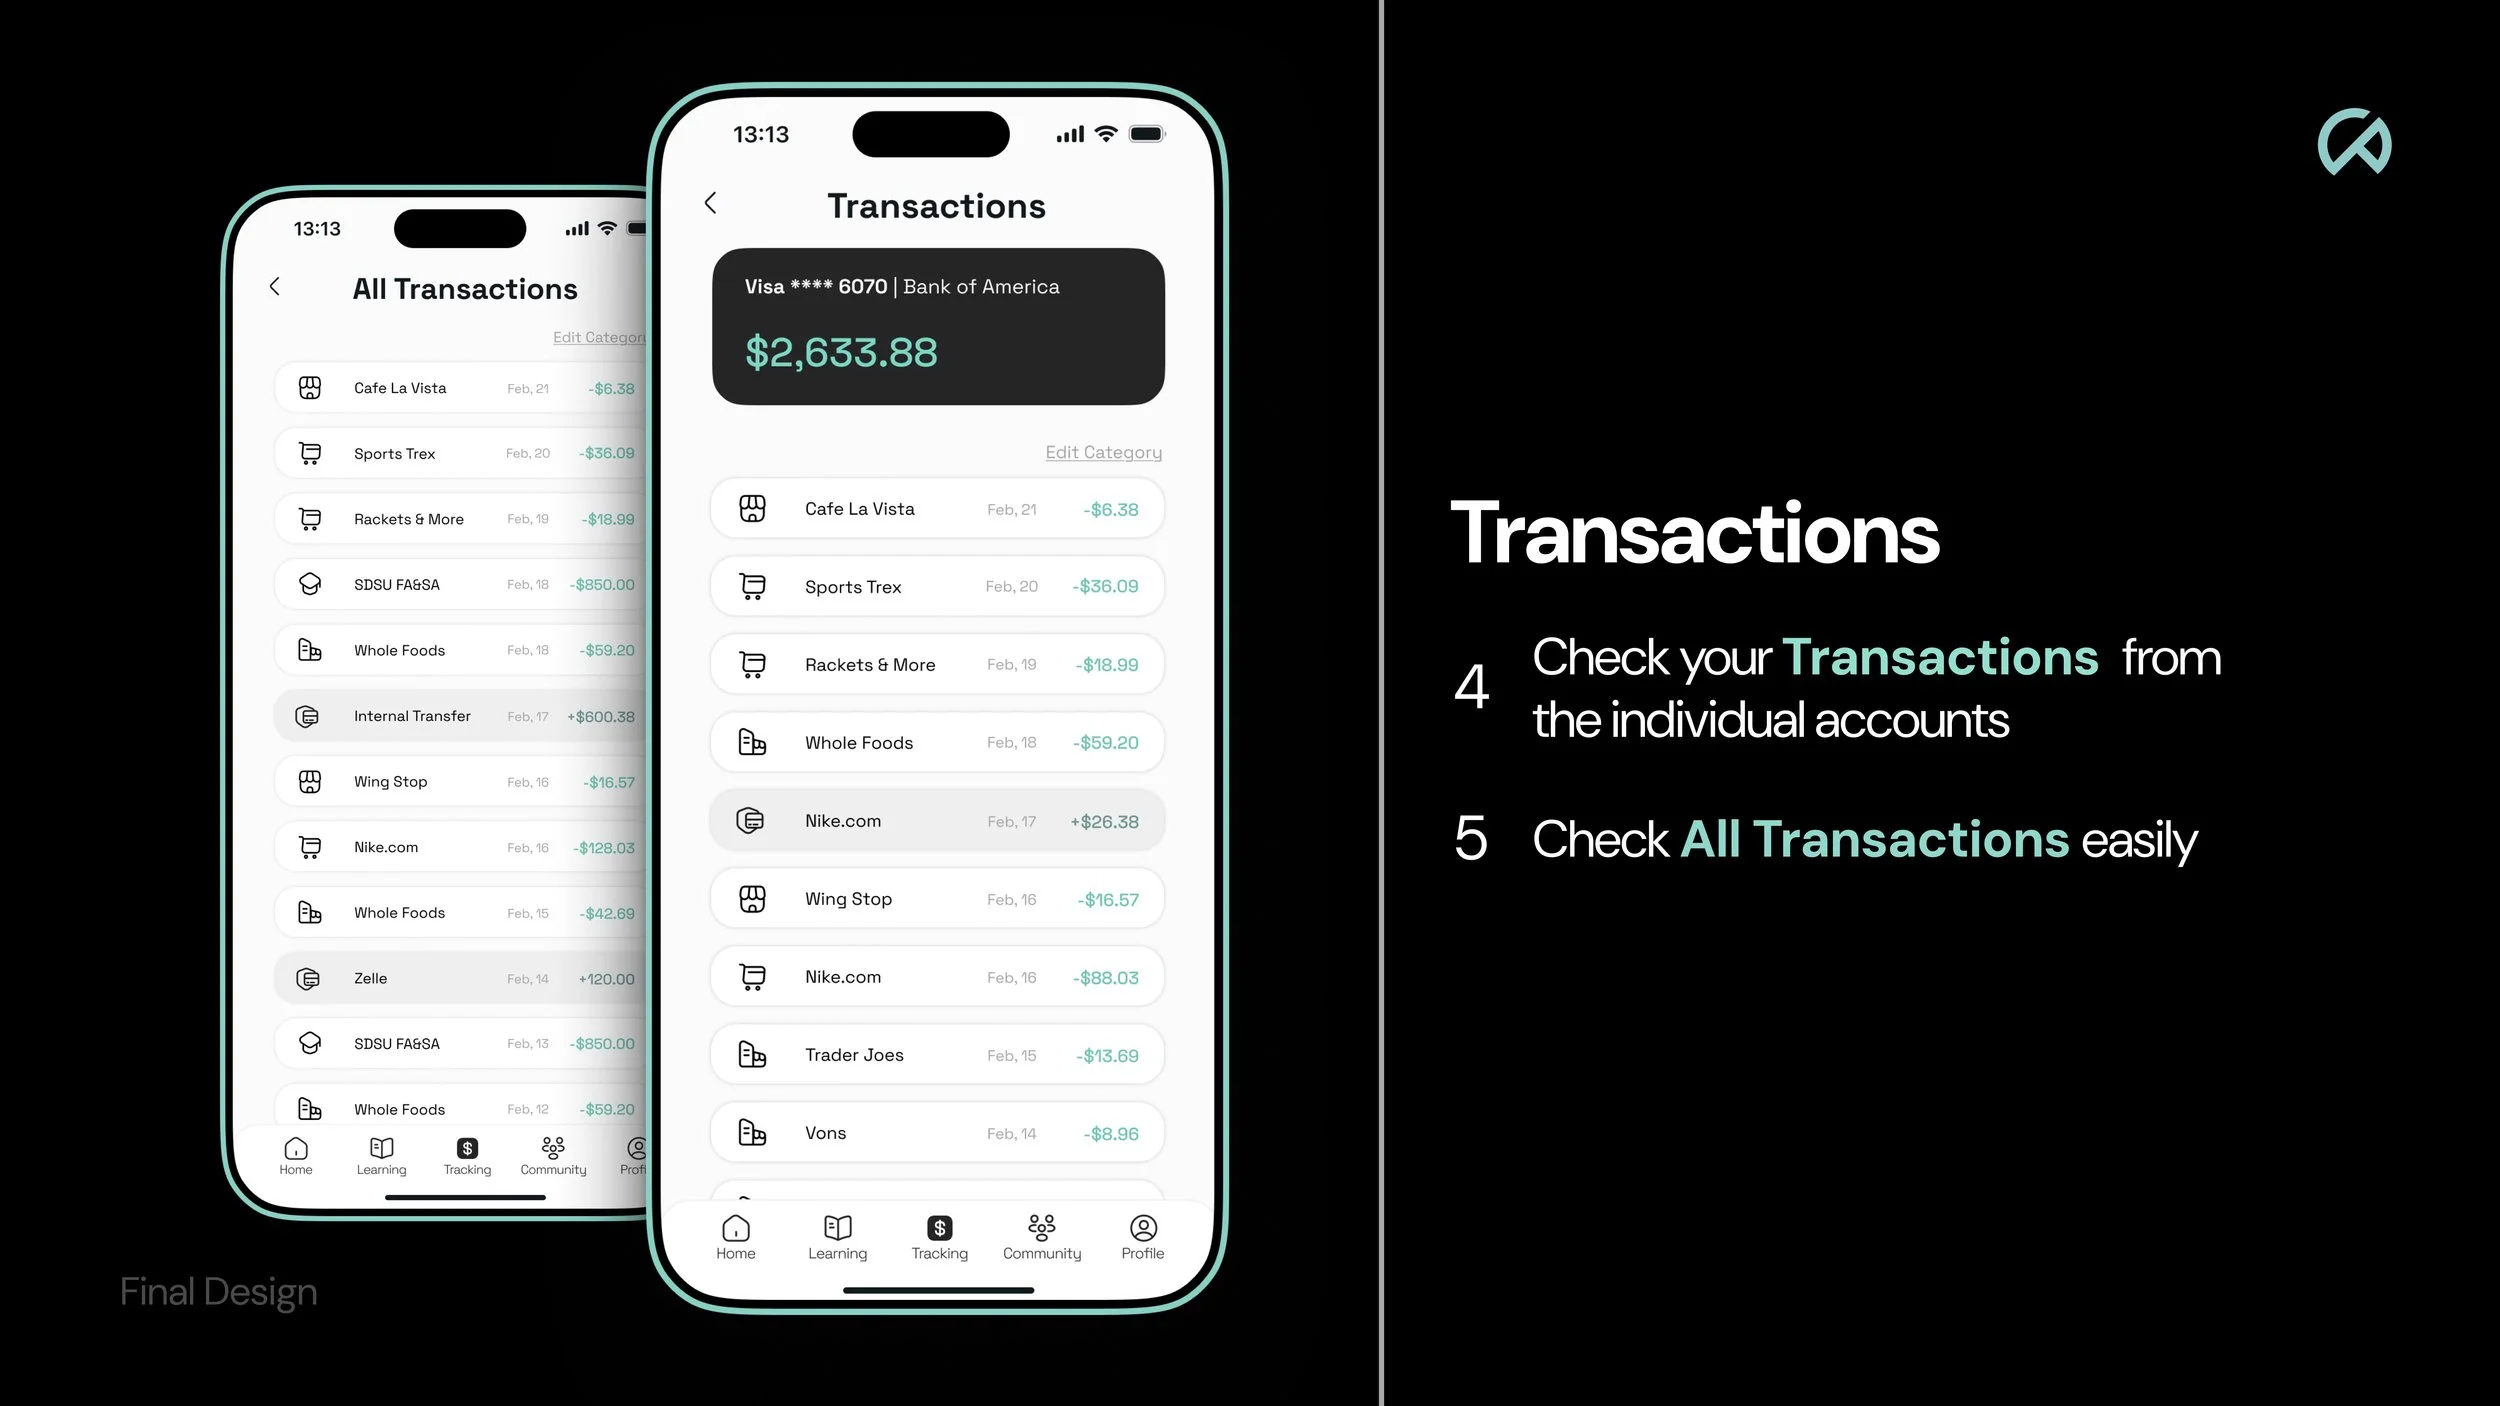
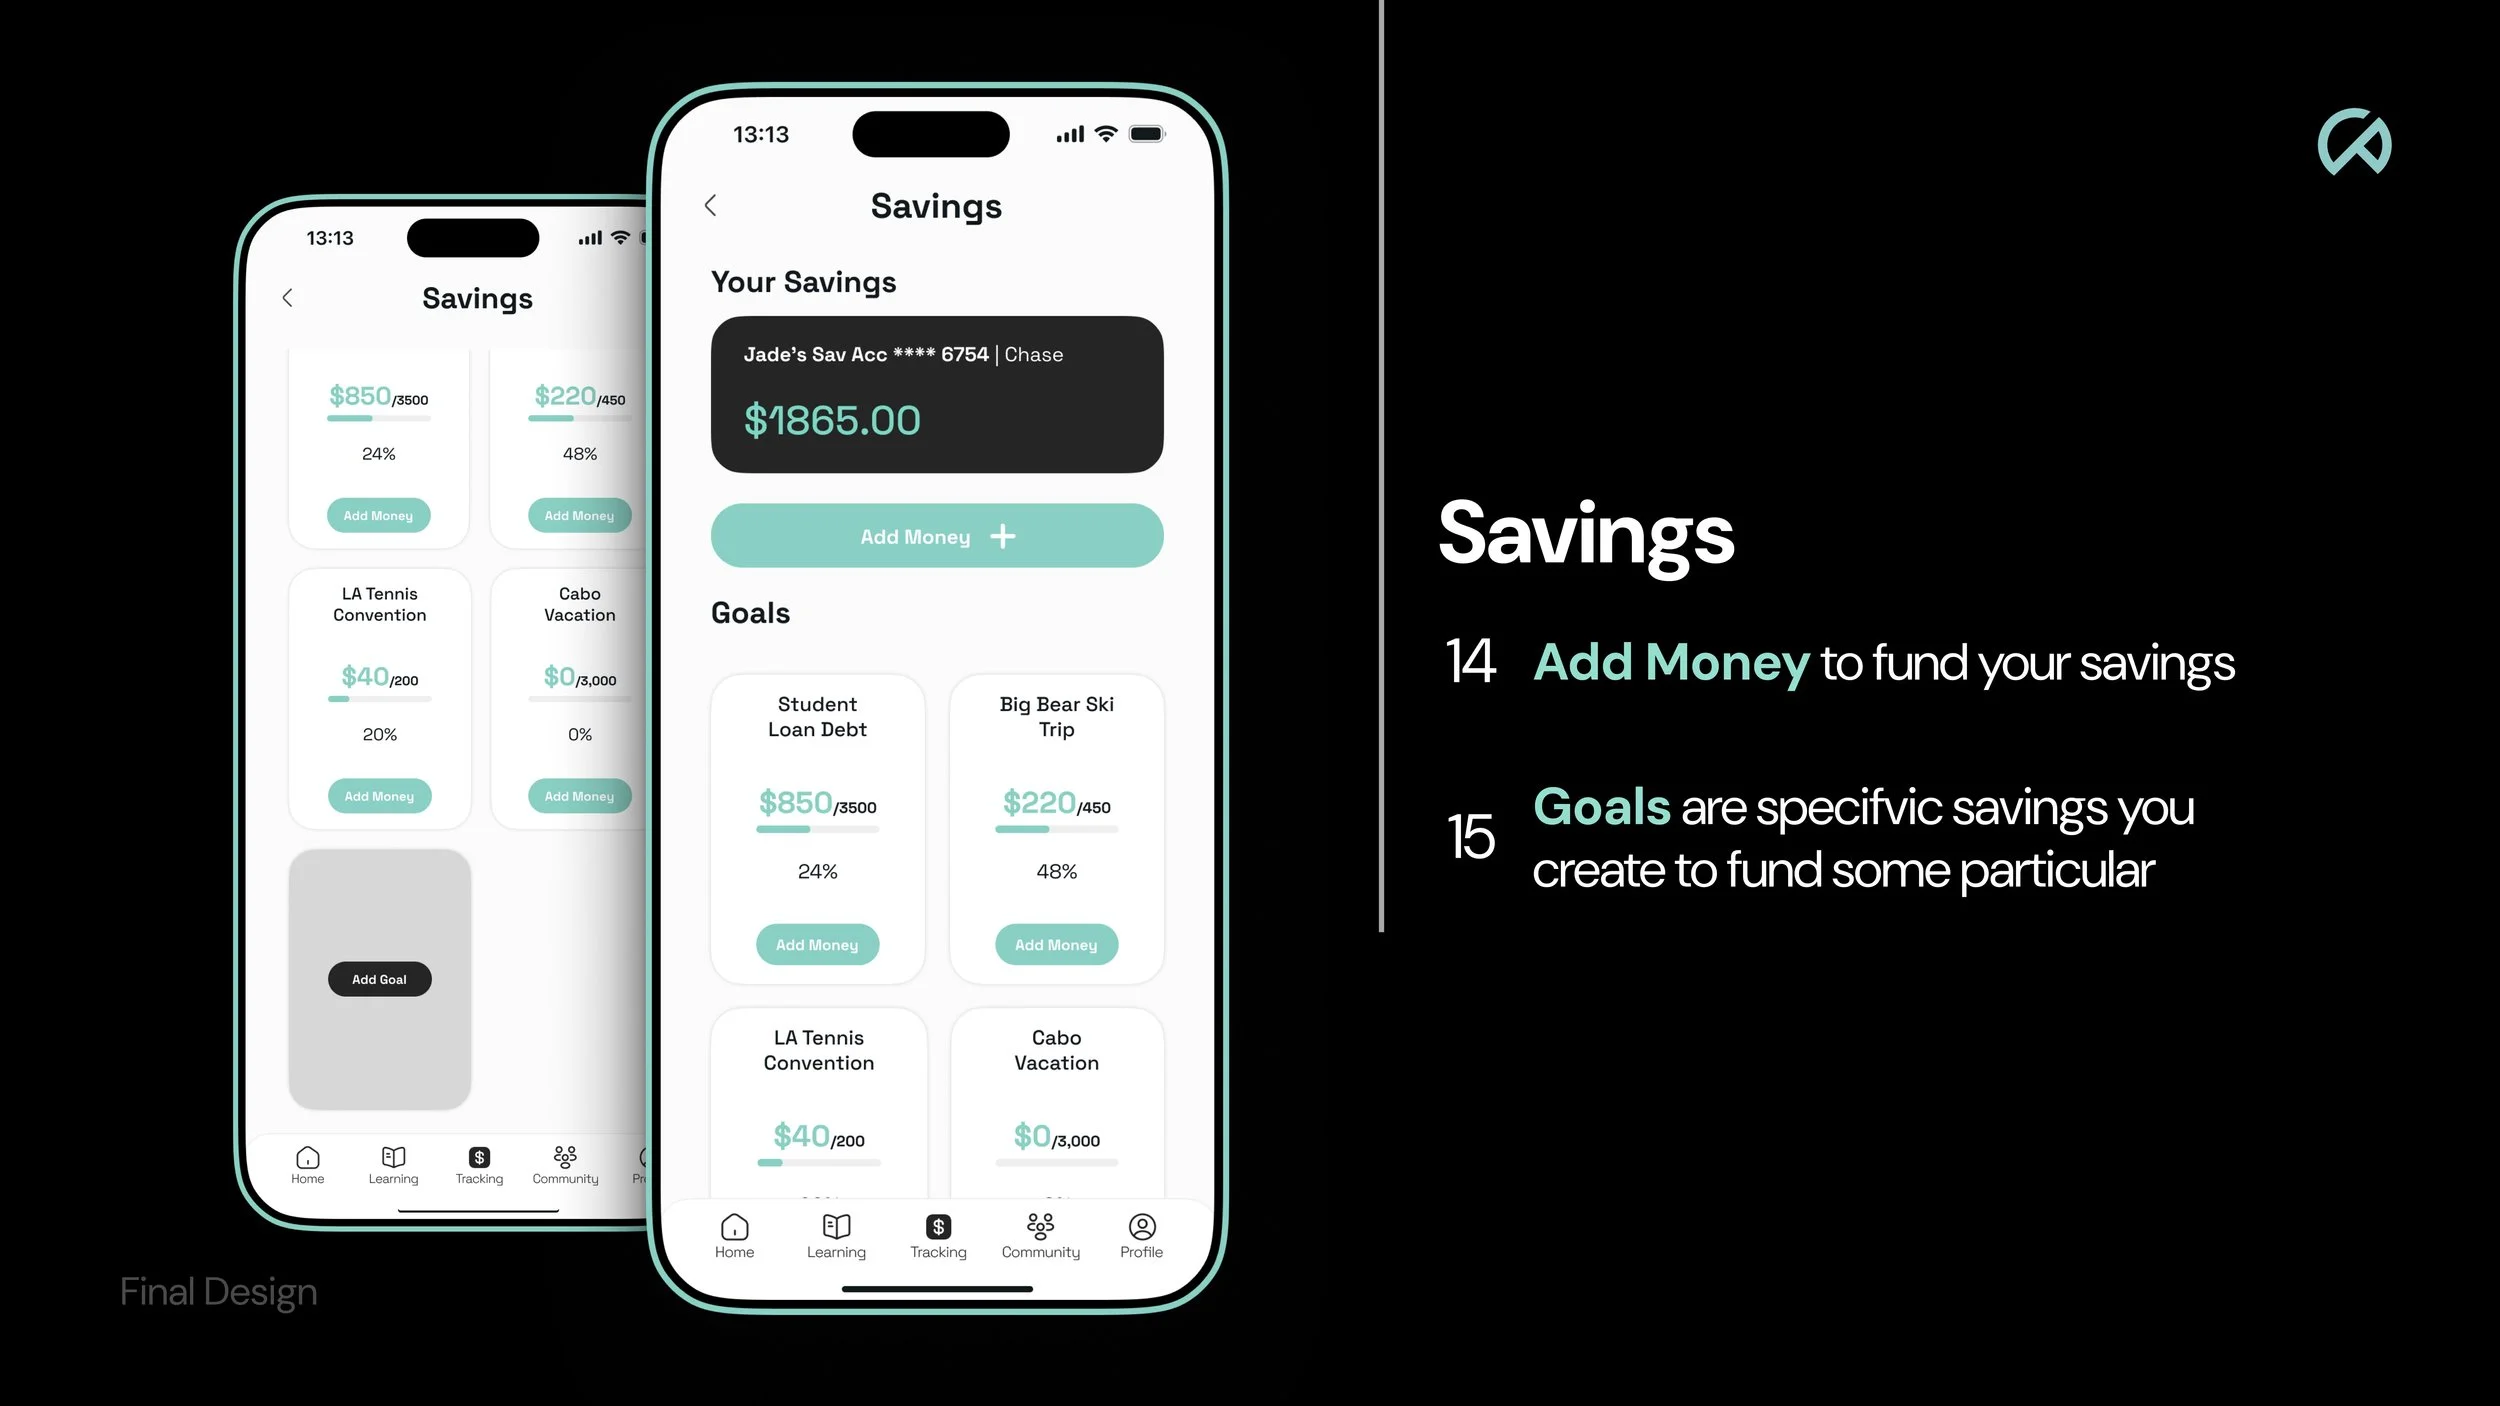
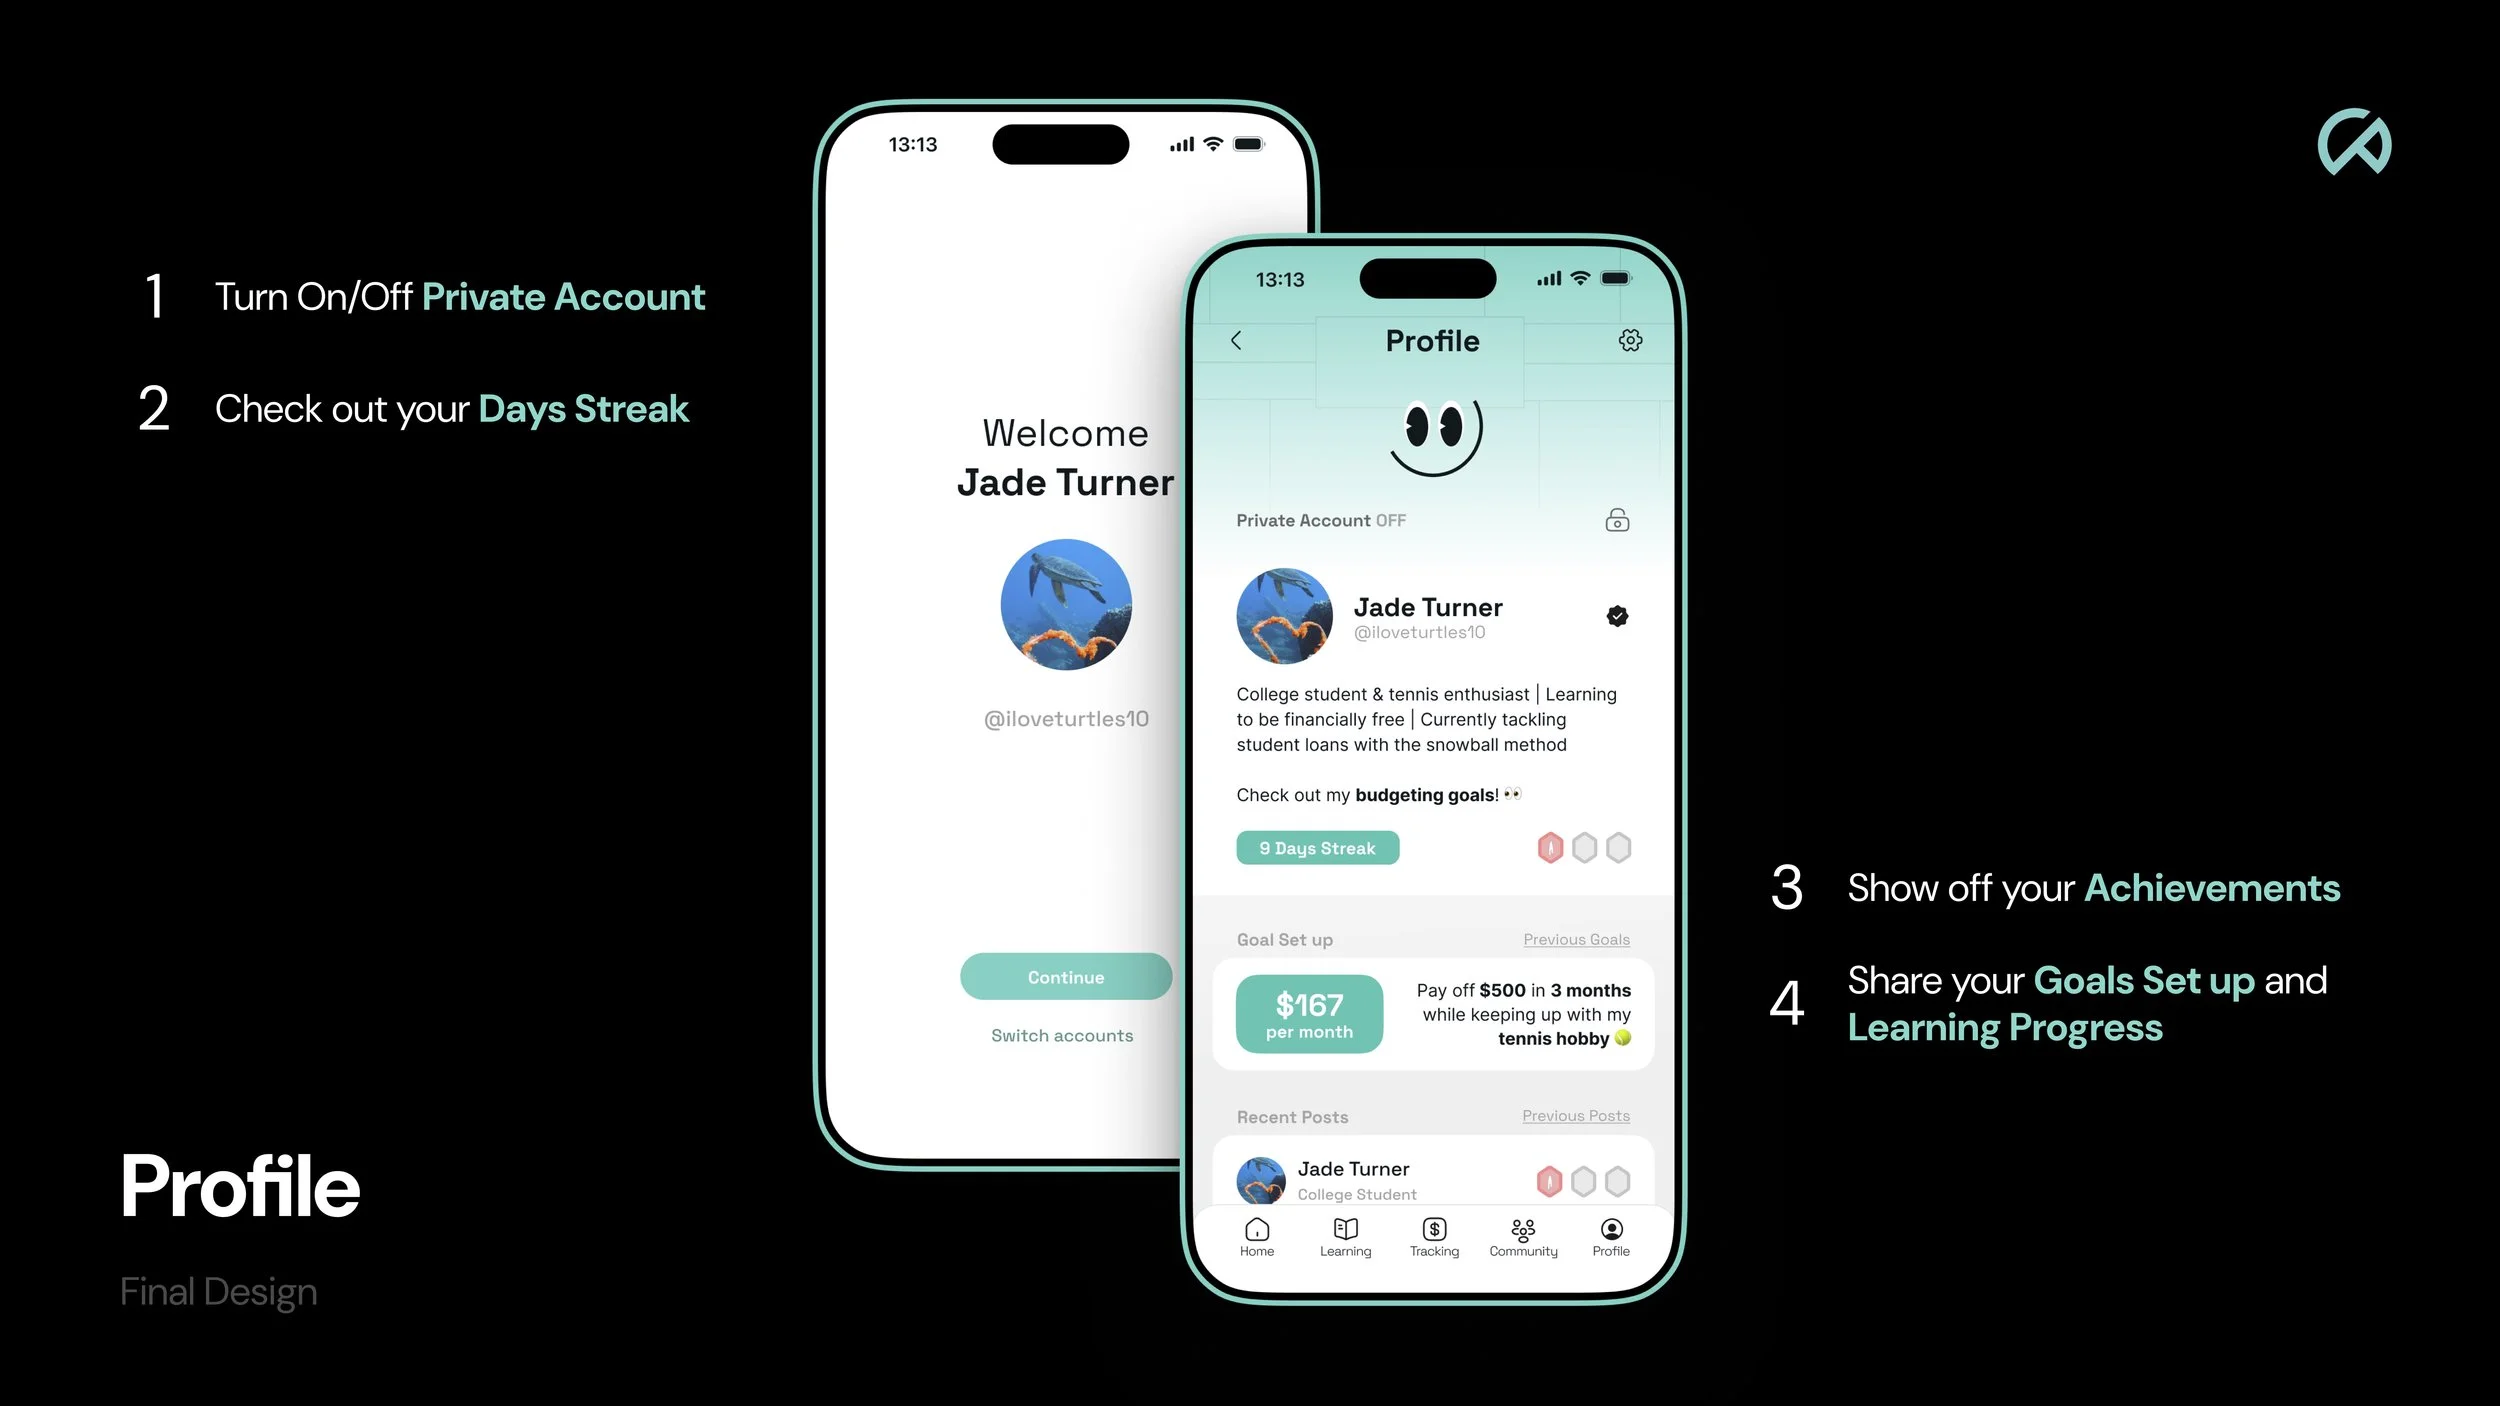
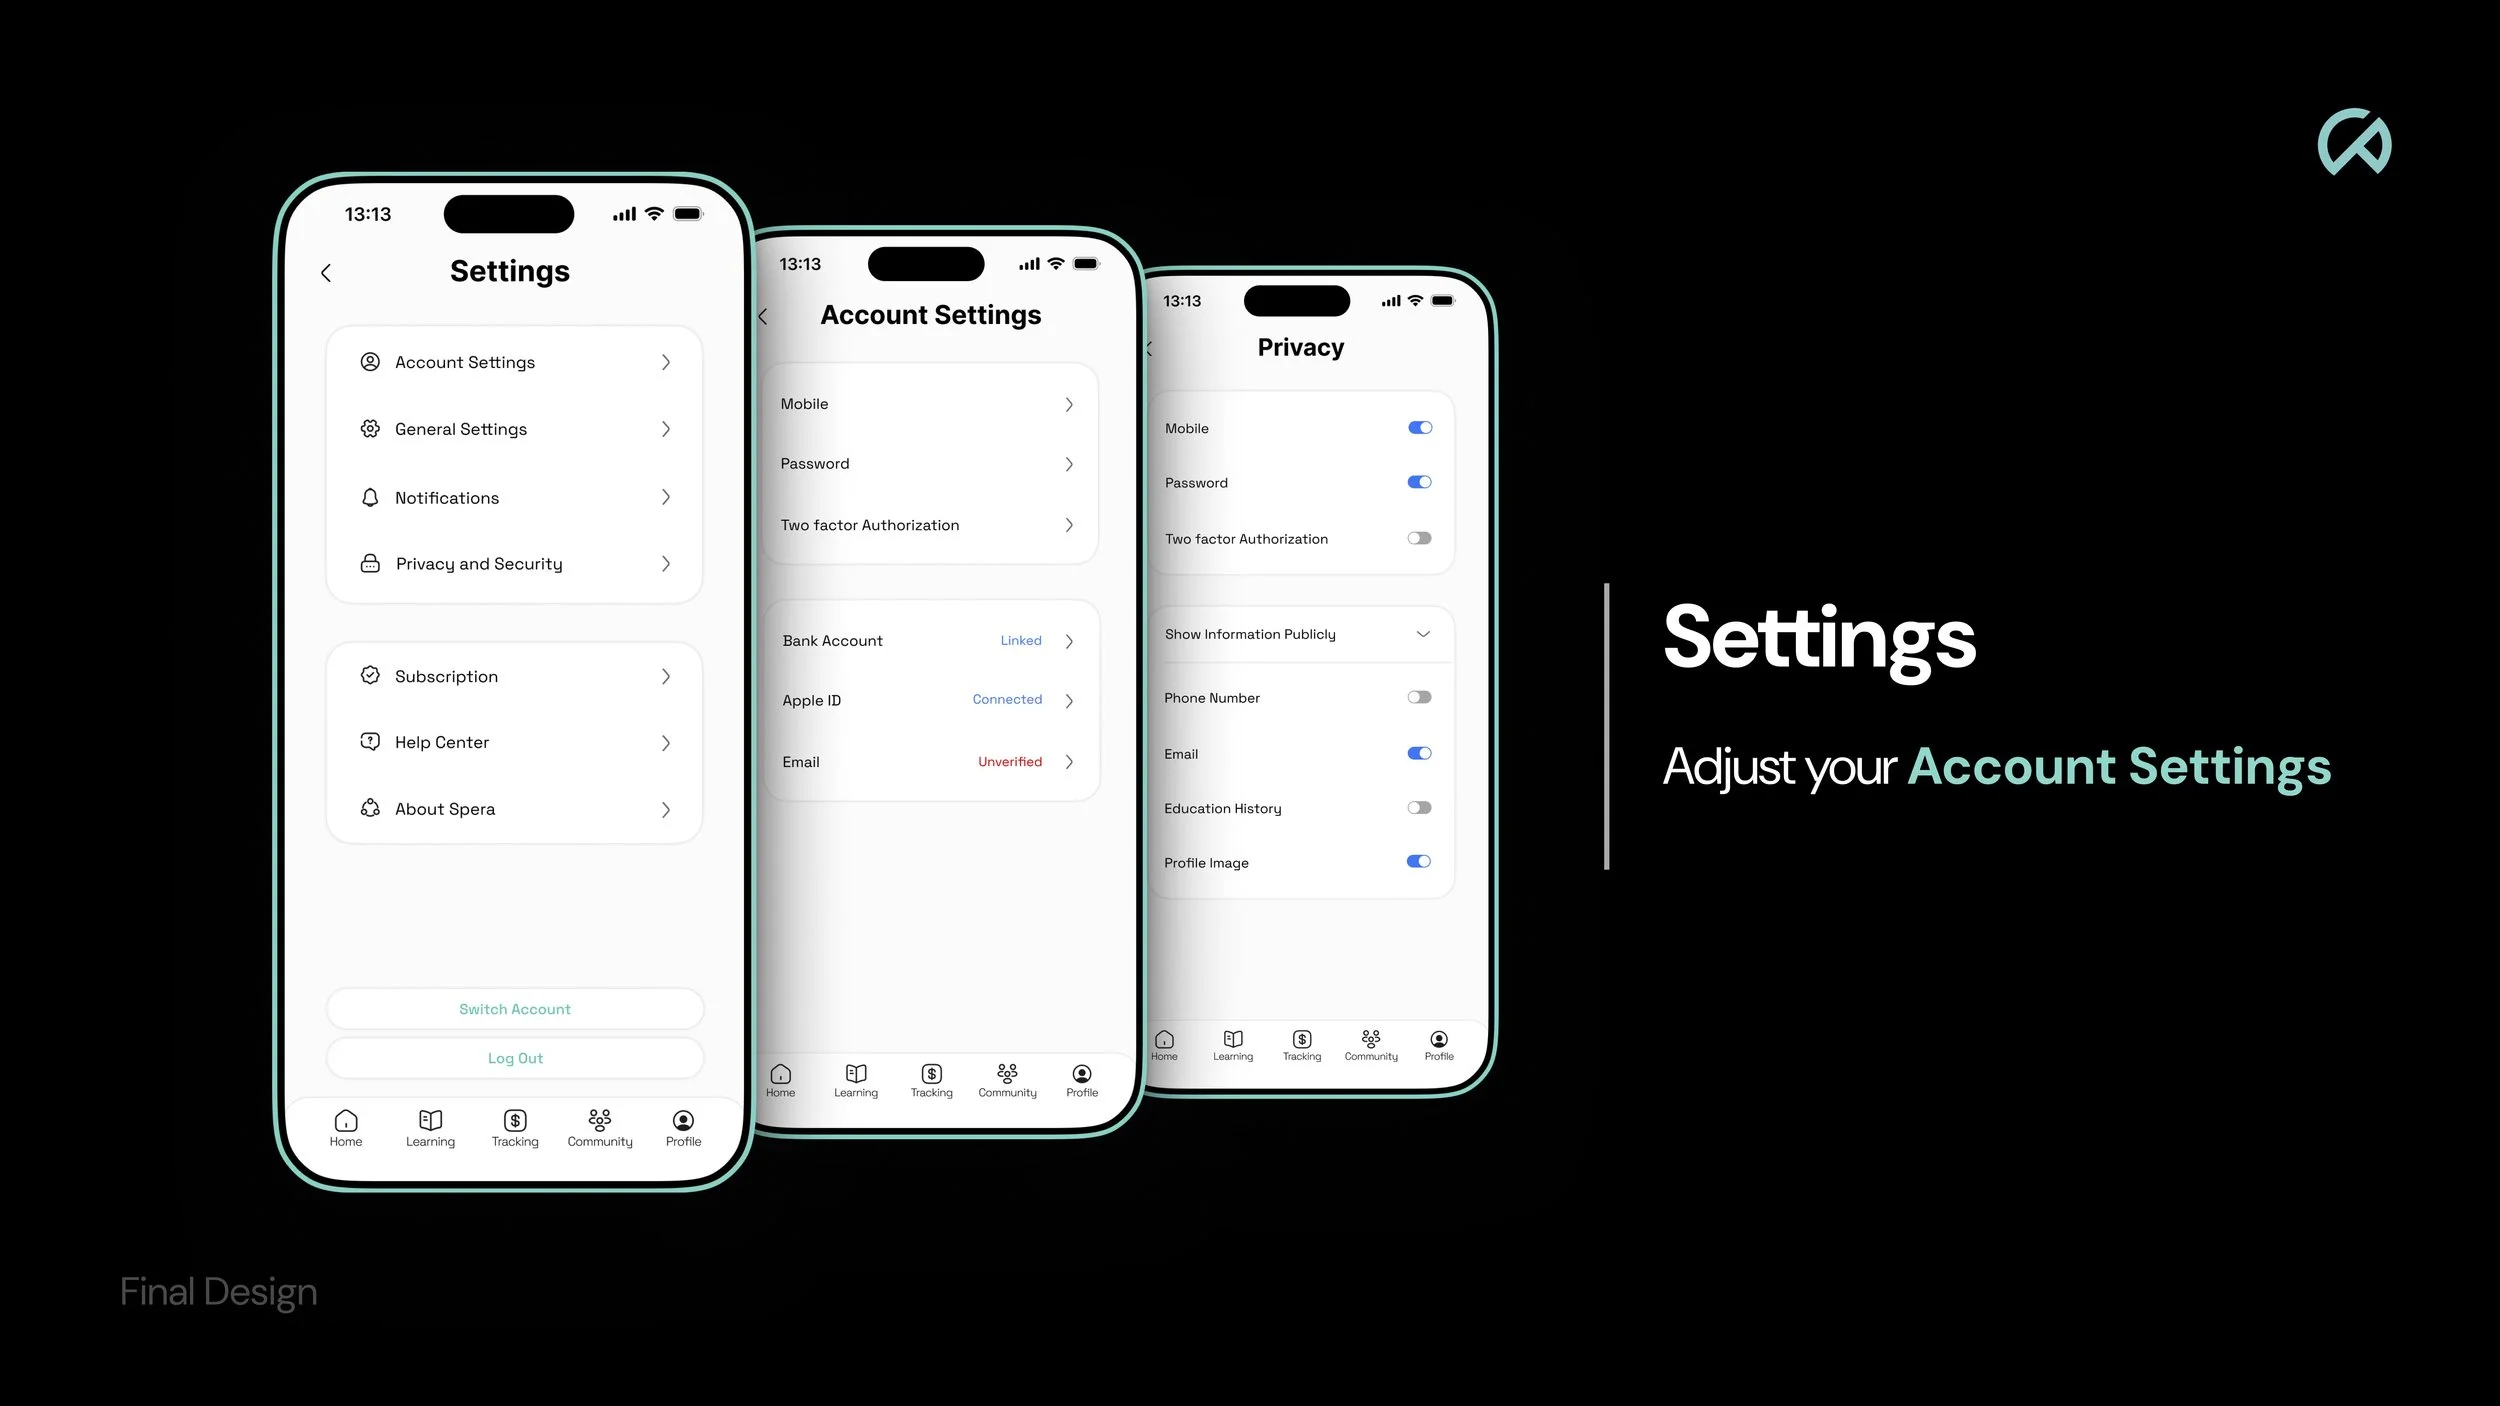
Multiple smartphones displaying financial and budgeting app screens, positioned on teal-colored platforms with a light gray background.

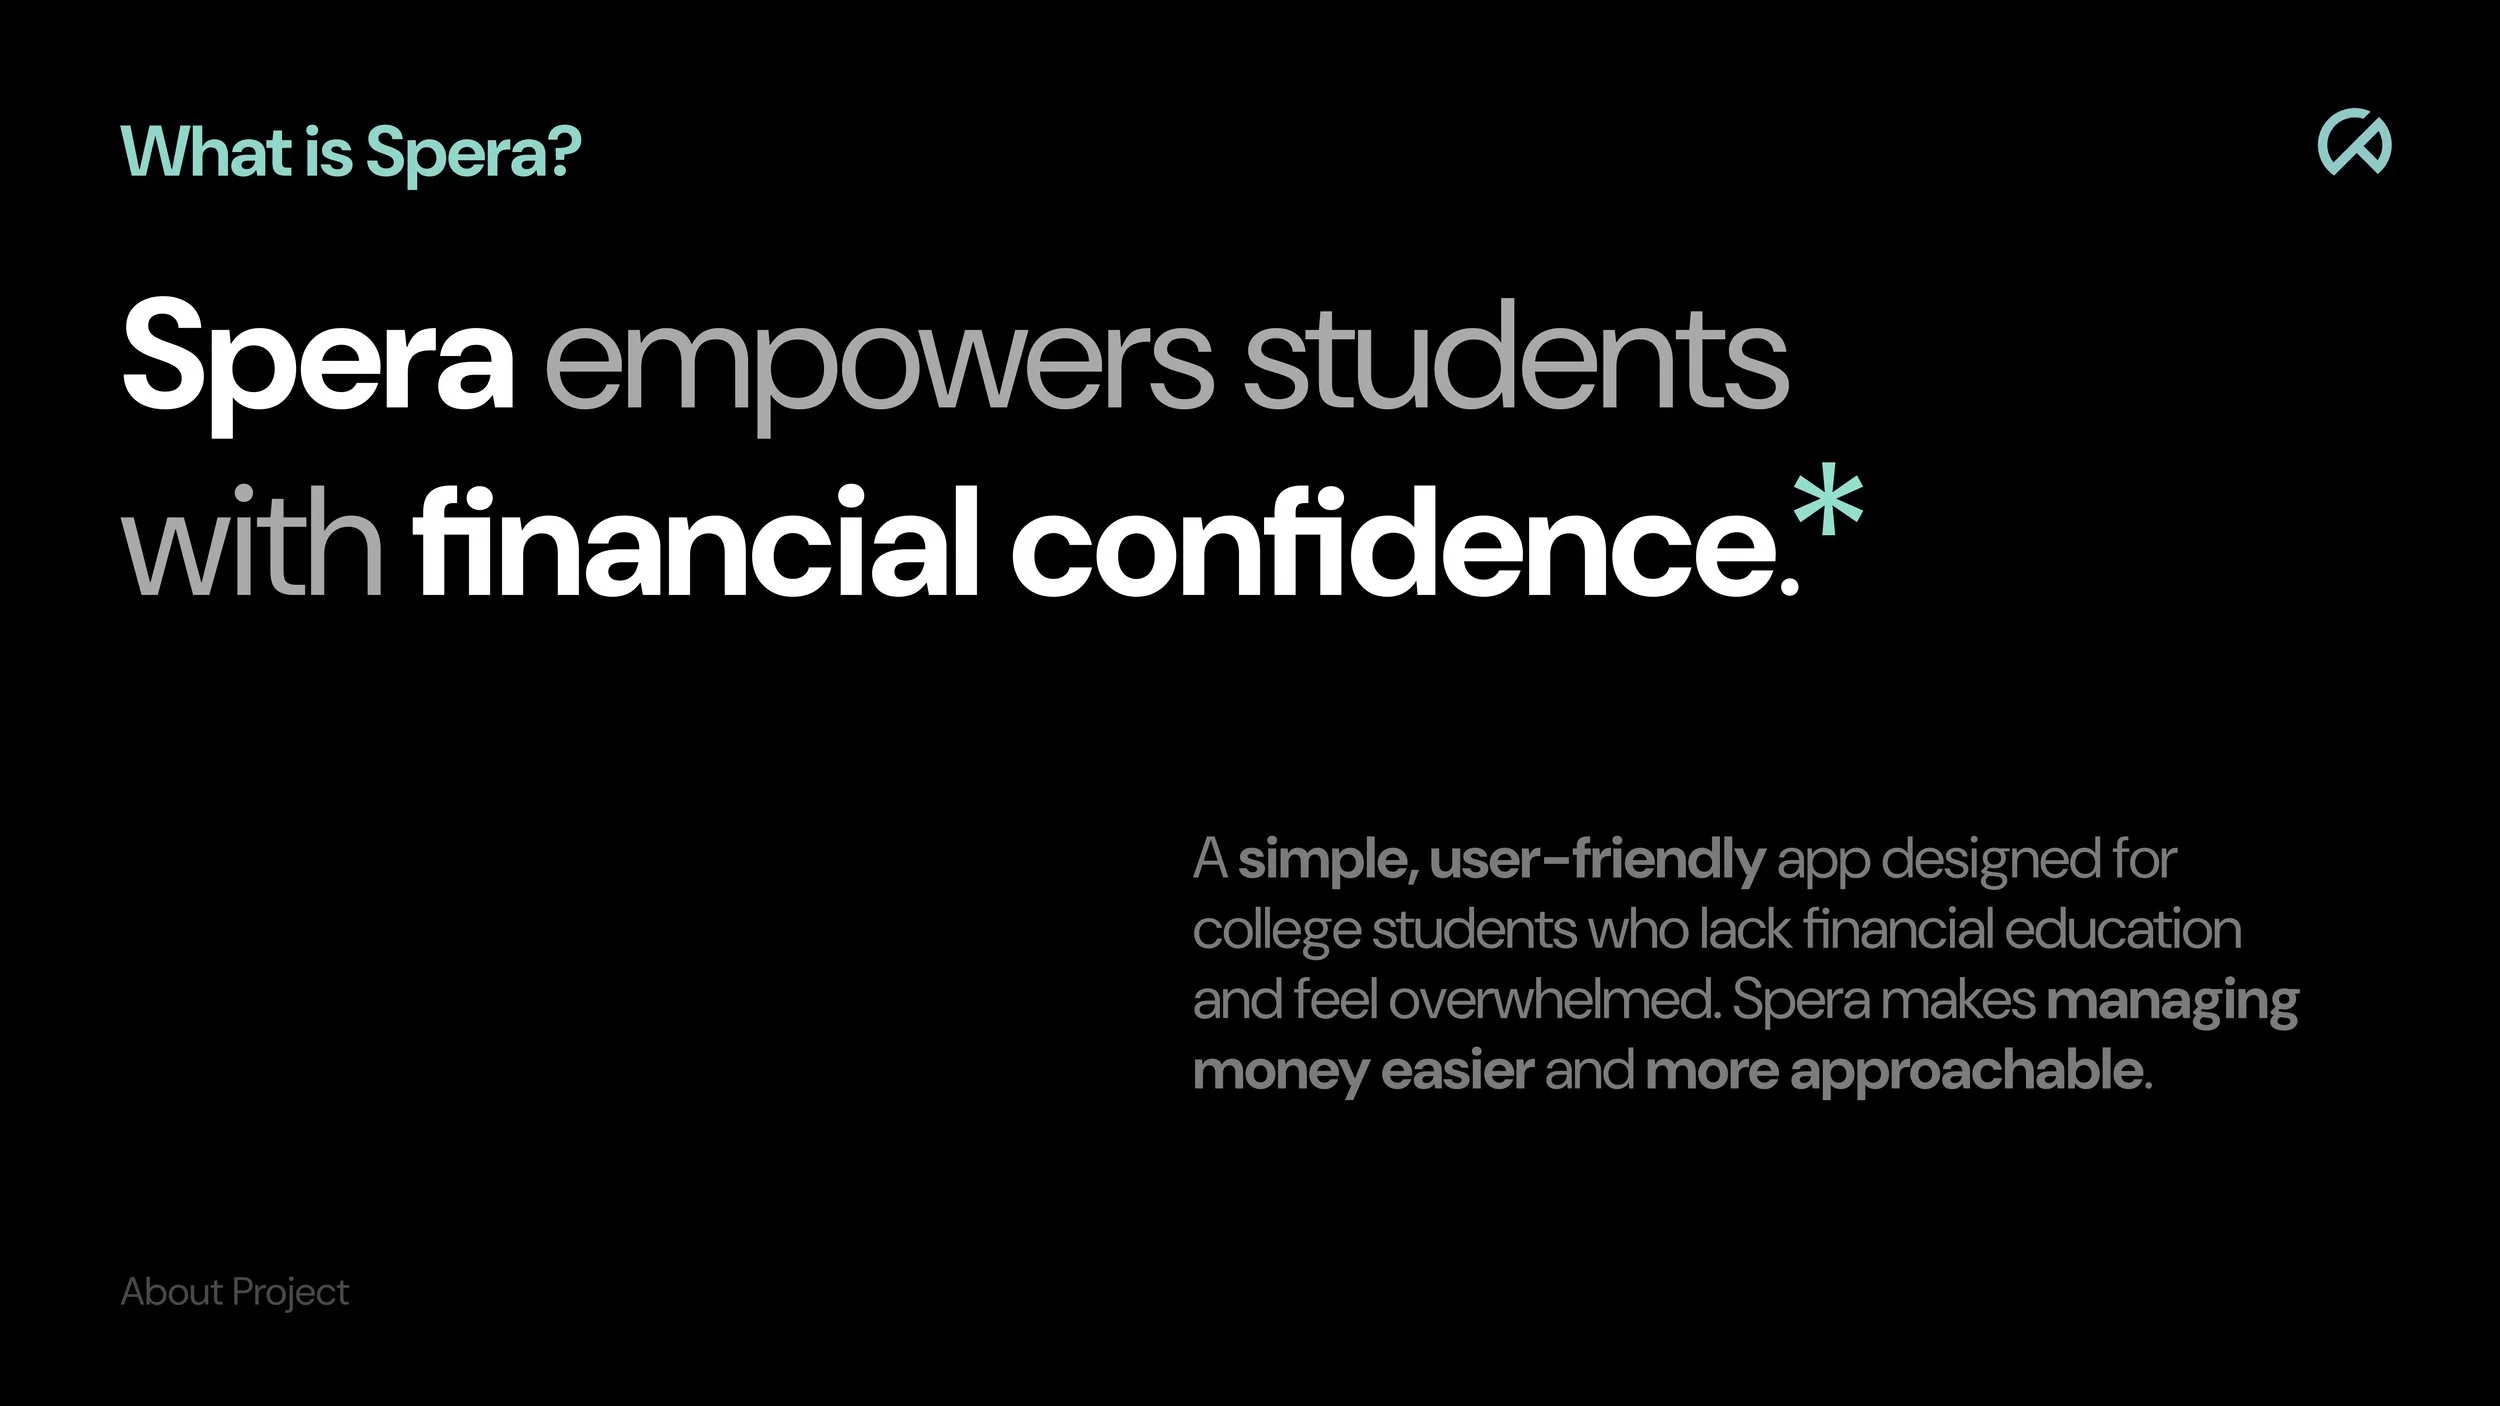
A digital application that makes managing money easier and more approachable to college students who have limited financial education or experience.

Spera

↓

Role

Timeline

Process

Tools

UI / UX, User Research, User Interviews, User Testing *Collaborative Project with Leo Song and Iris Xu.

Discovery & Research: 1 month

Design & Testing: 1.5 months

Overall: 2.5 months

Problem Identification

Research

Ideation

Design

Miro, Figma, Adobe Photoshop, Adobe Illustrator

Problem

Many college students don’t receive proper financial education it leaves them unprepared to manage their finances independently.

As they gain financial responsibility, they often feel overwhelmed by budgeting, saving, and decision-making, which can lead to poor financial choices.

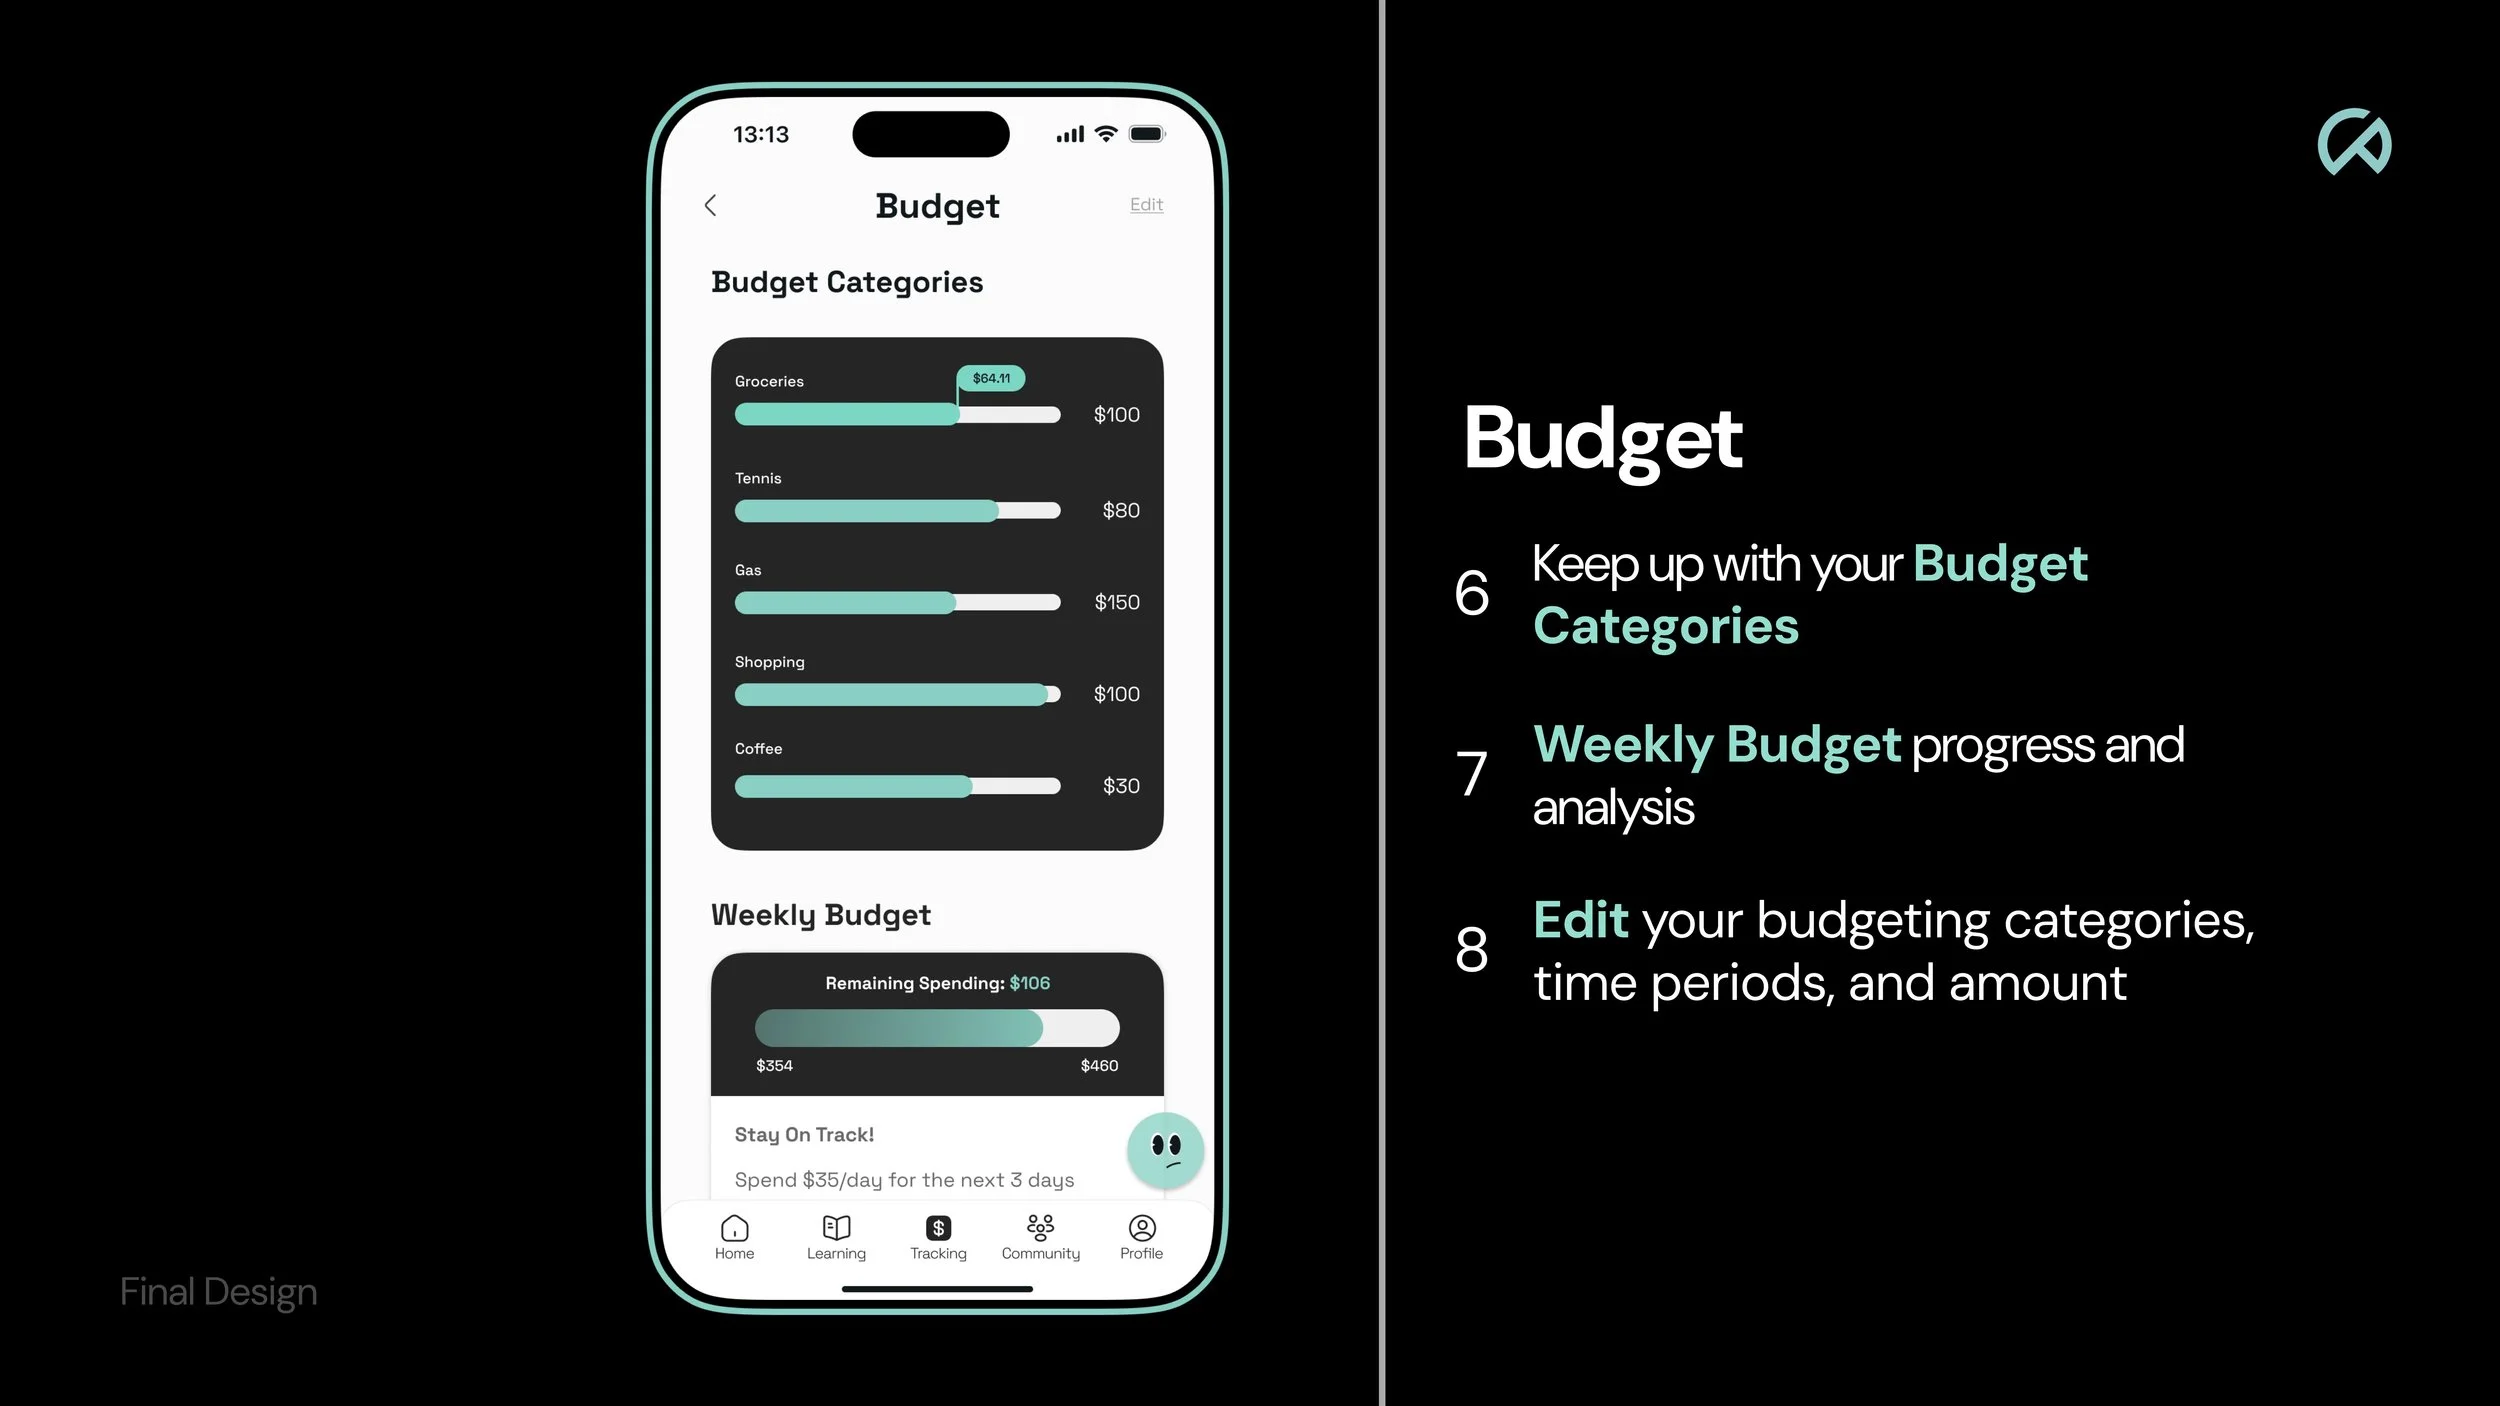
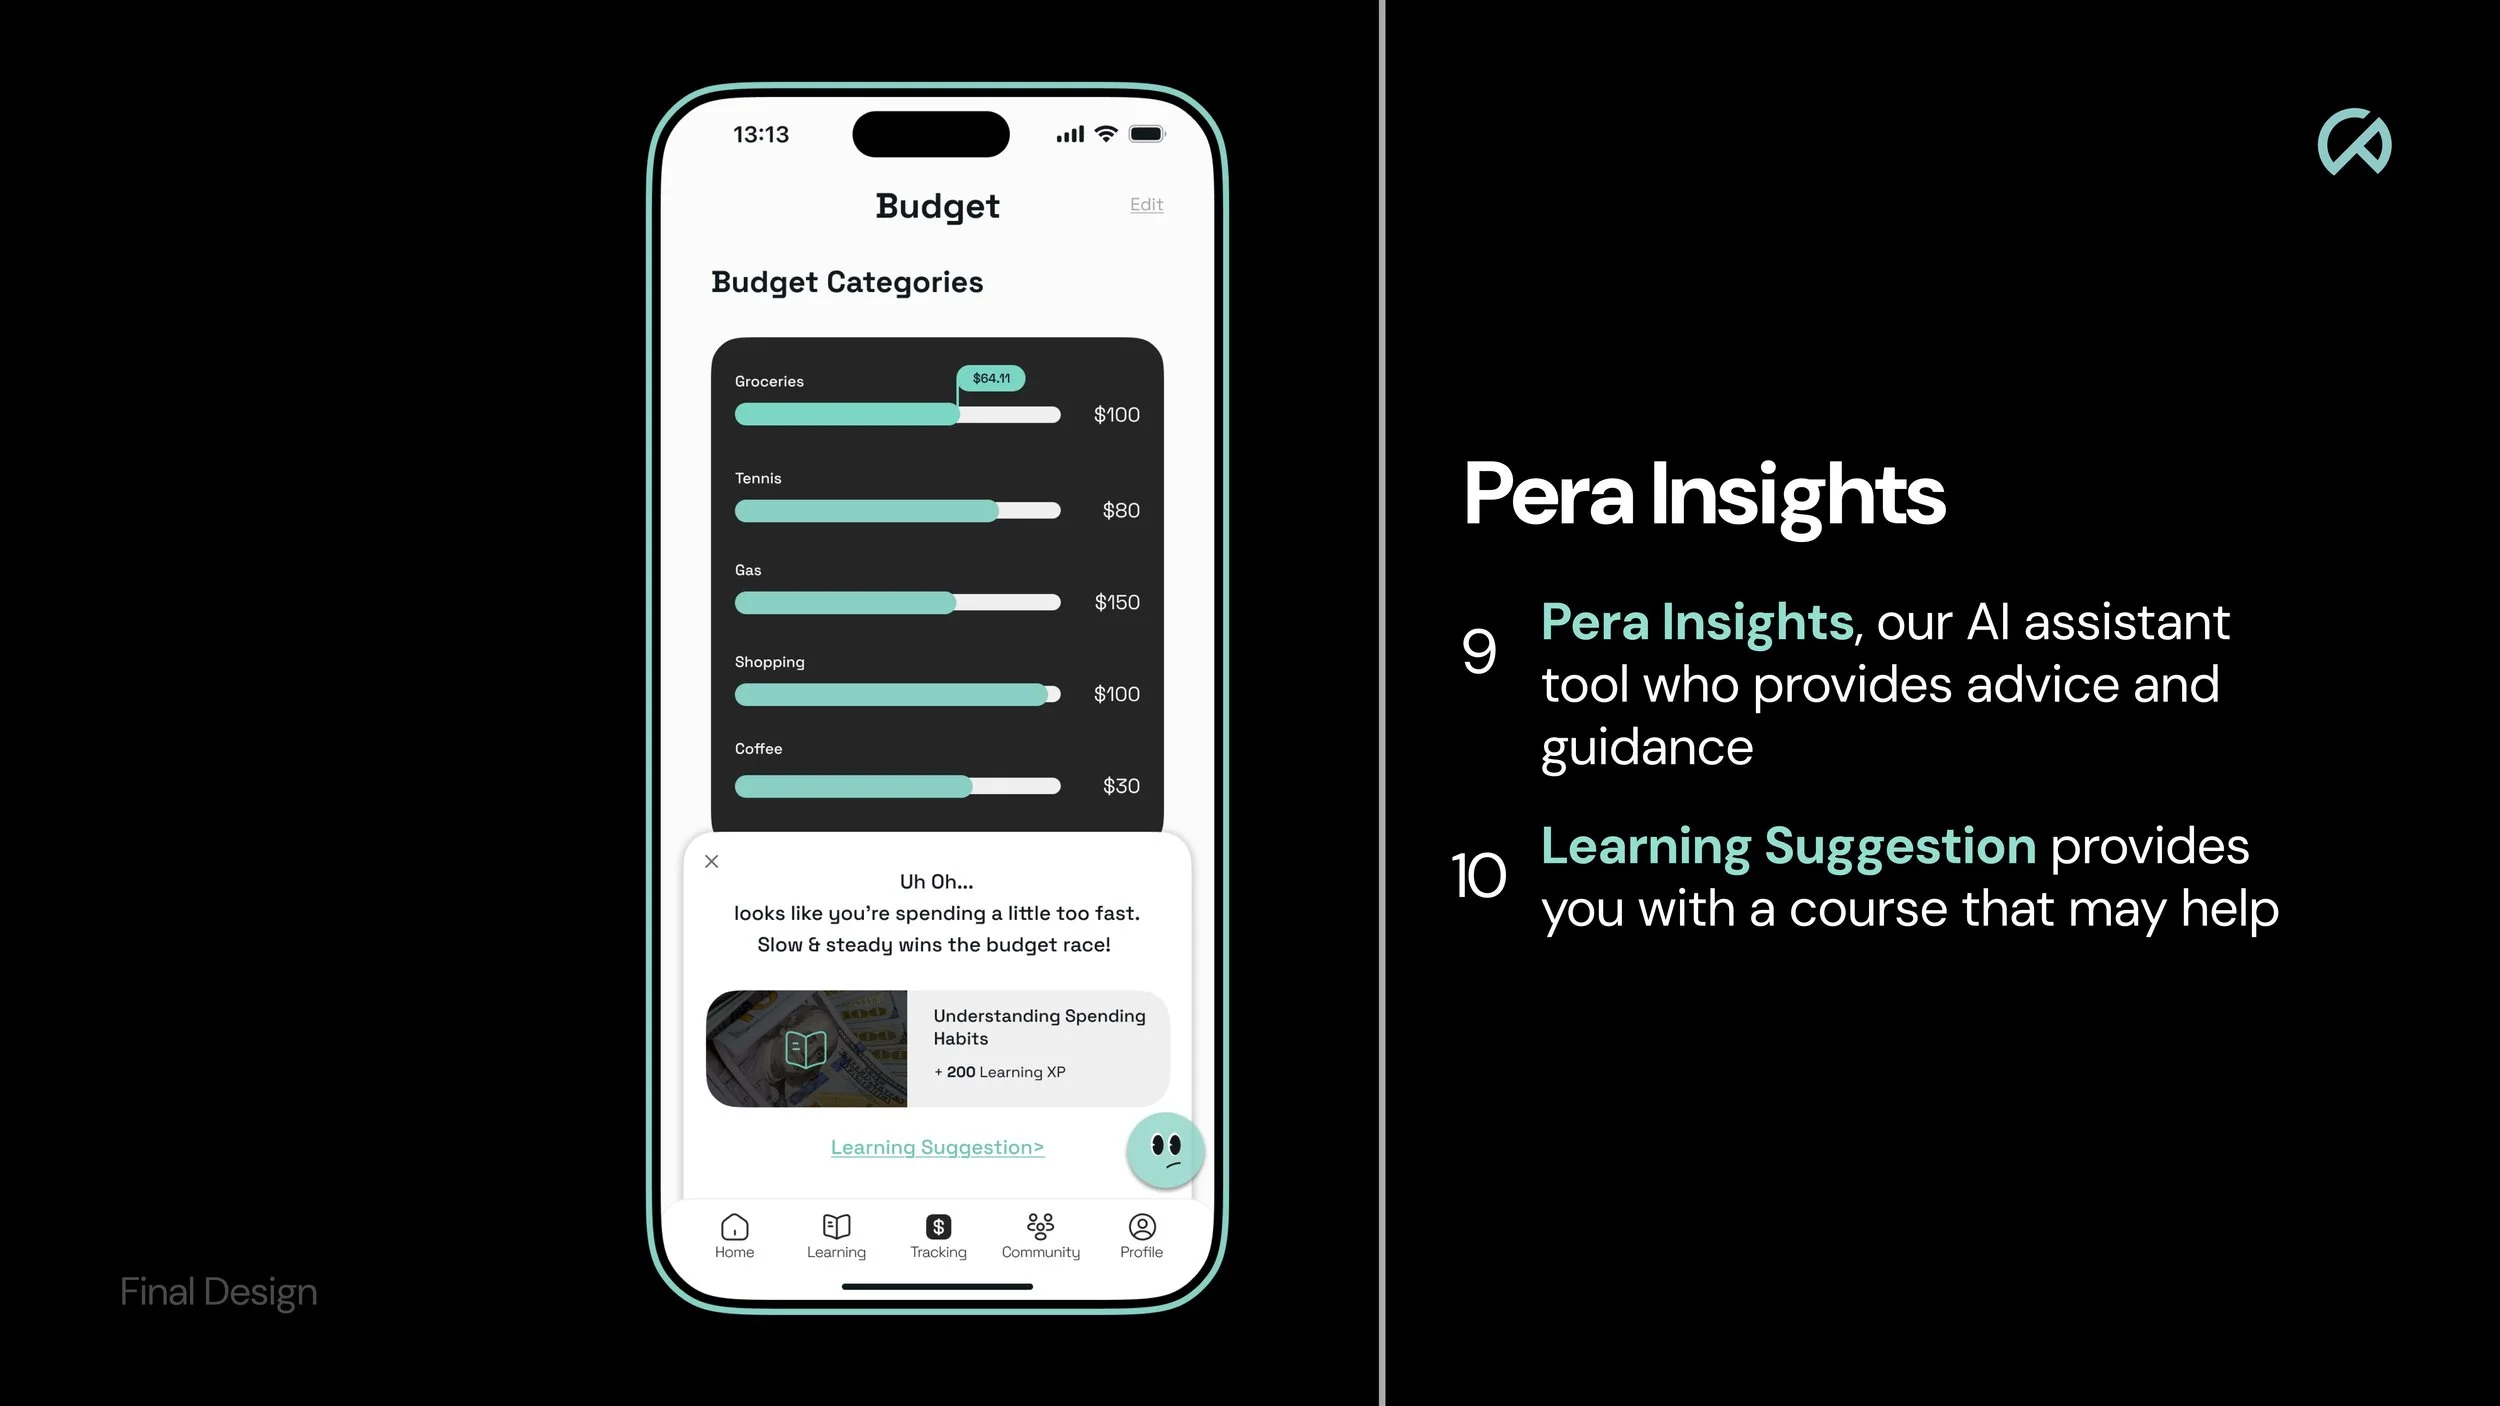
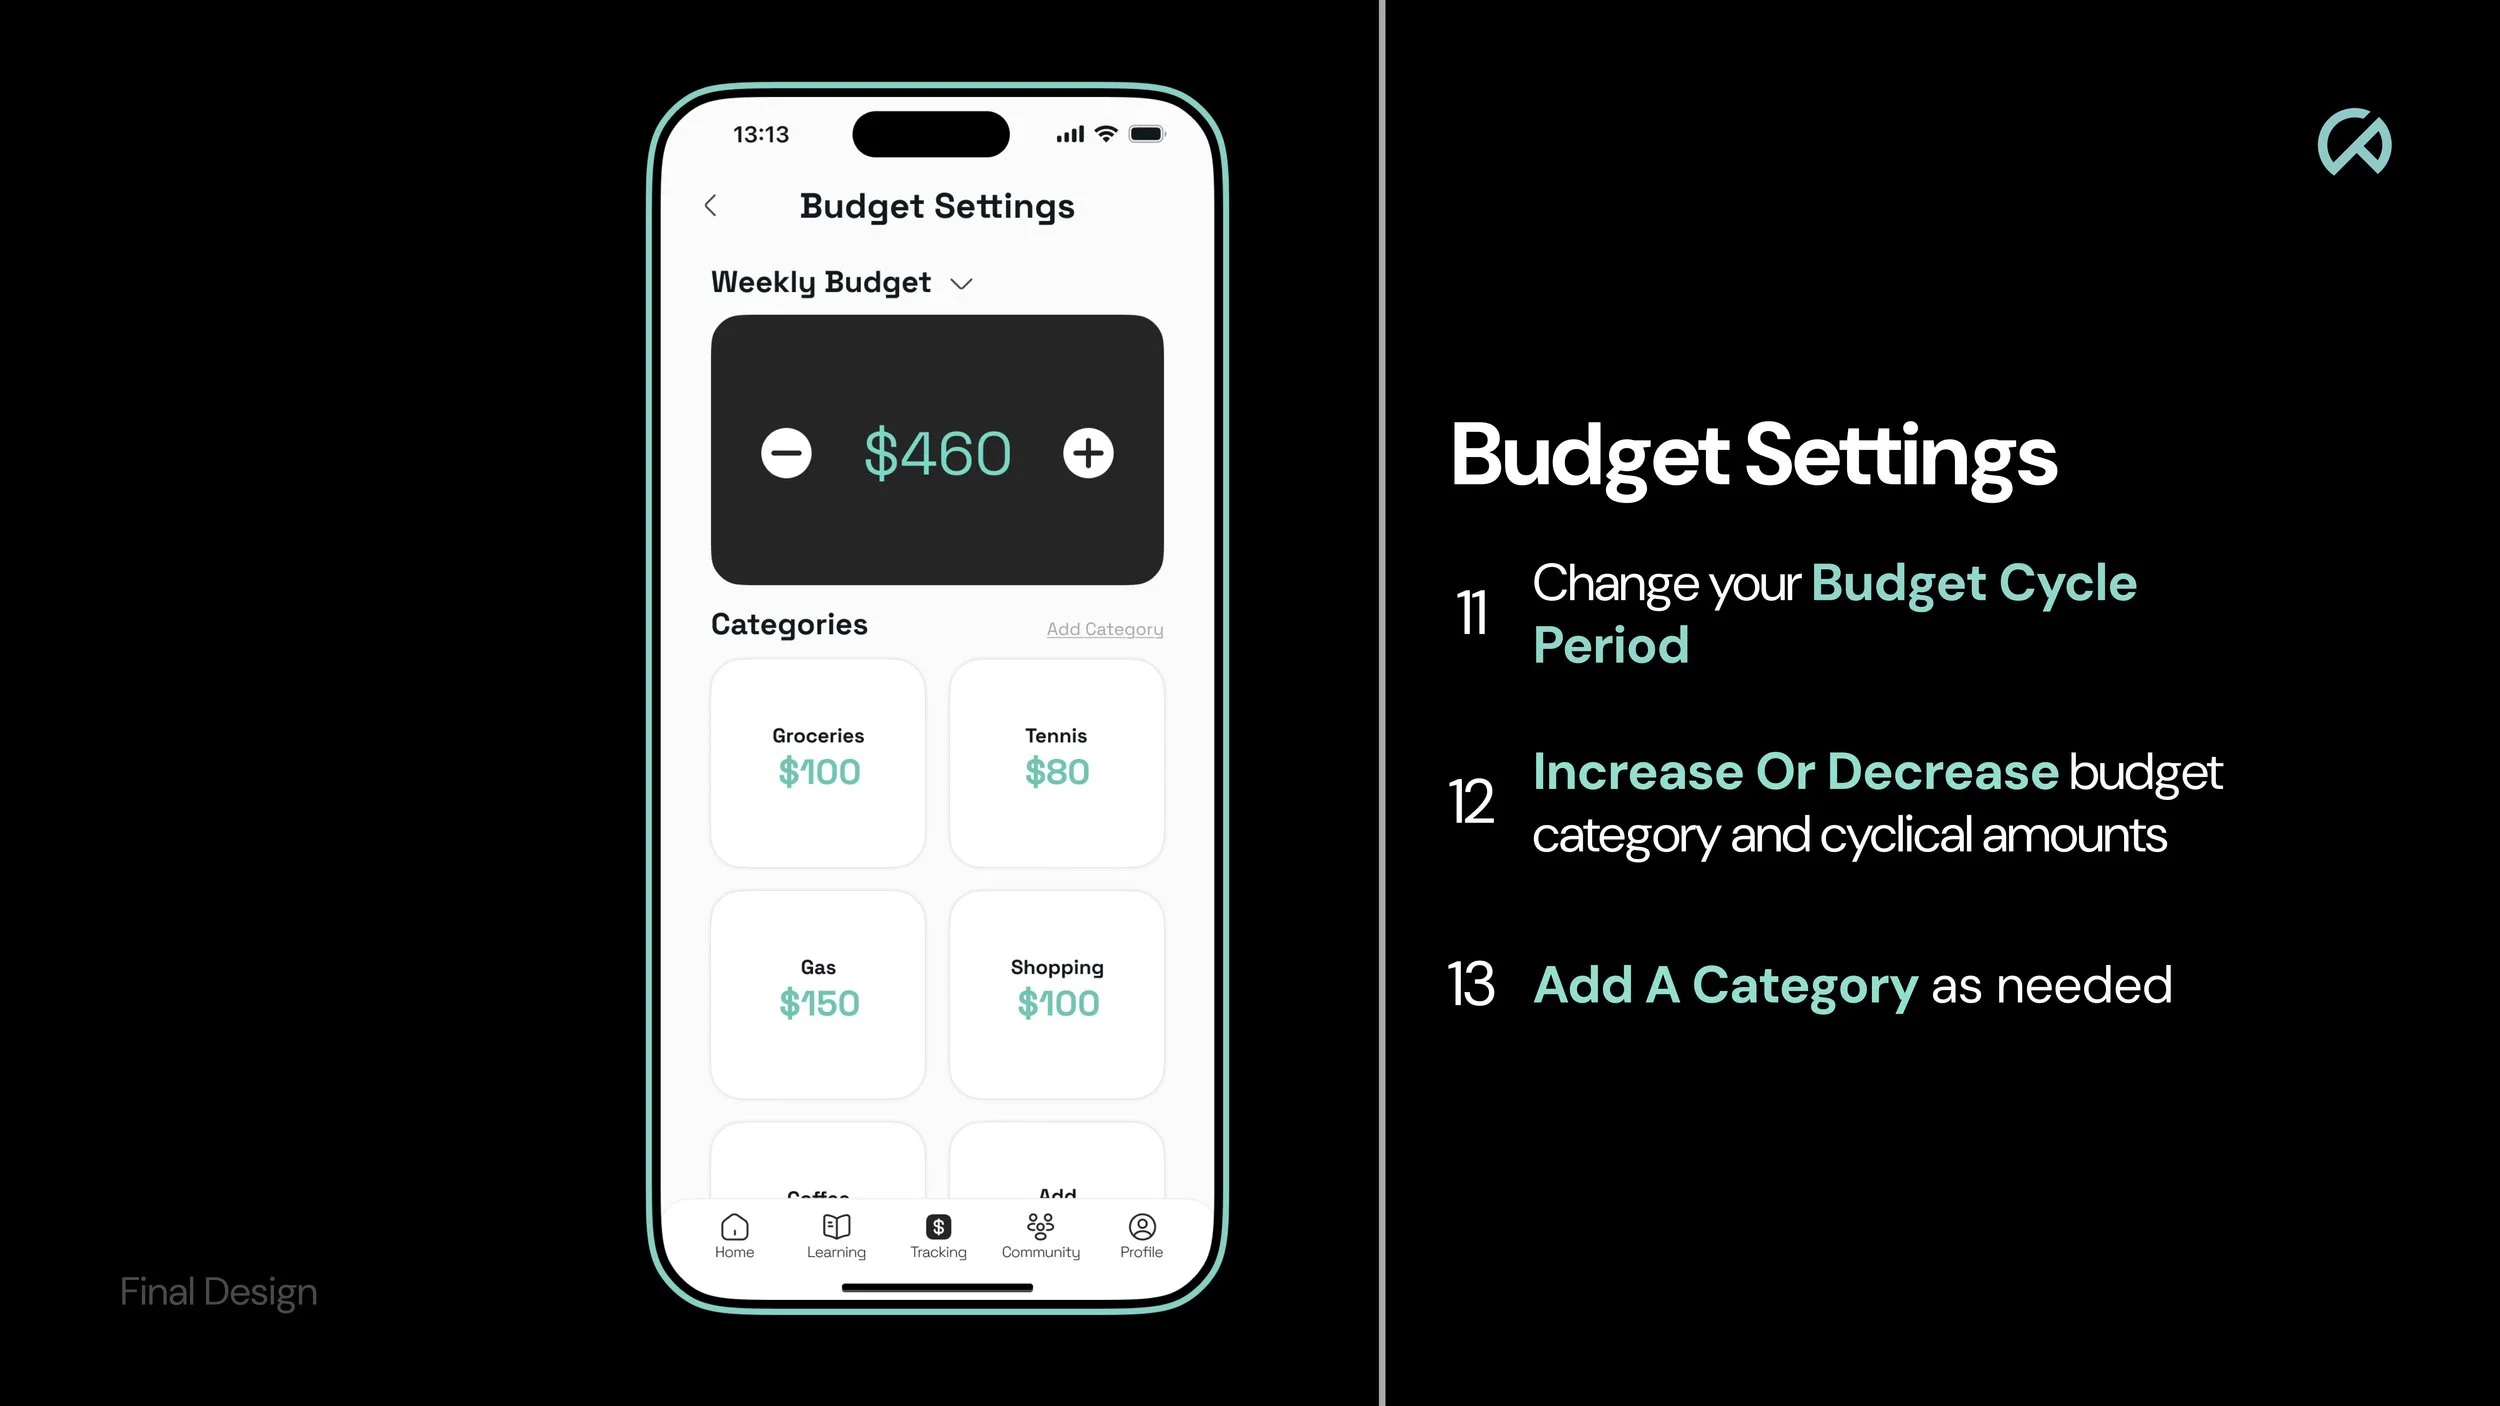
A smartphone screen displaying a budget app with categories for groceries, tennis, gas, shopping, and coffee, showing spending amounts and a message about spending too fast.

Solution

A smartphone screen displaying a financial literacy quiz app with a question about student loans and options to borrow either $7,000 or the full $10,000, along with navigation icons at the bottom for home, learning, tracking, community, and profile.

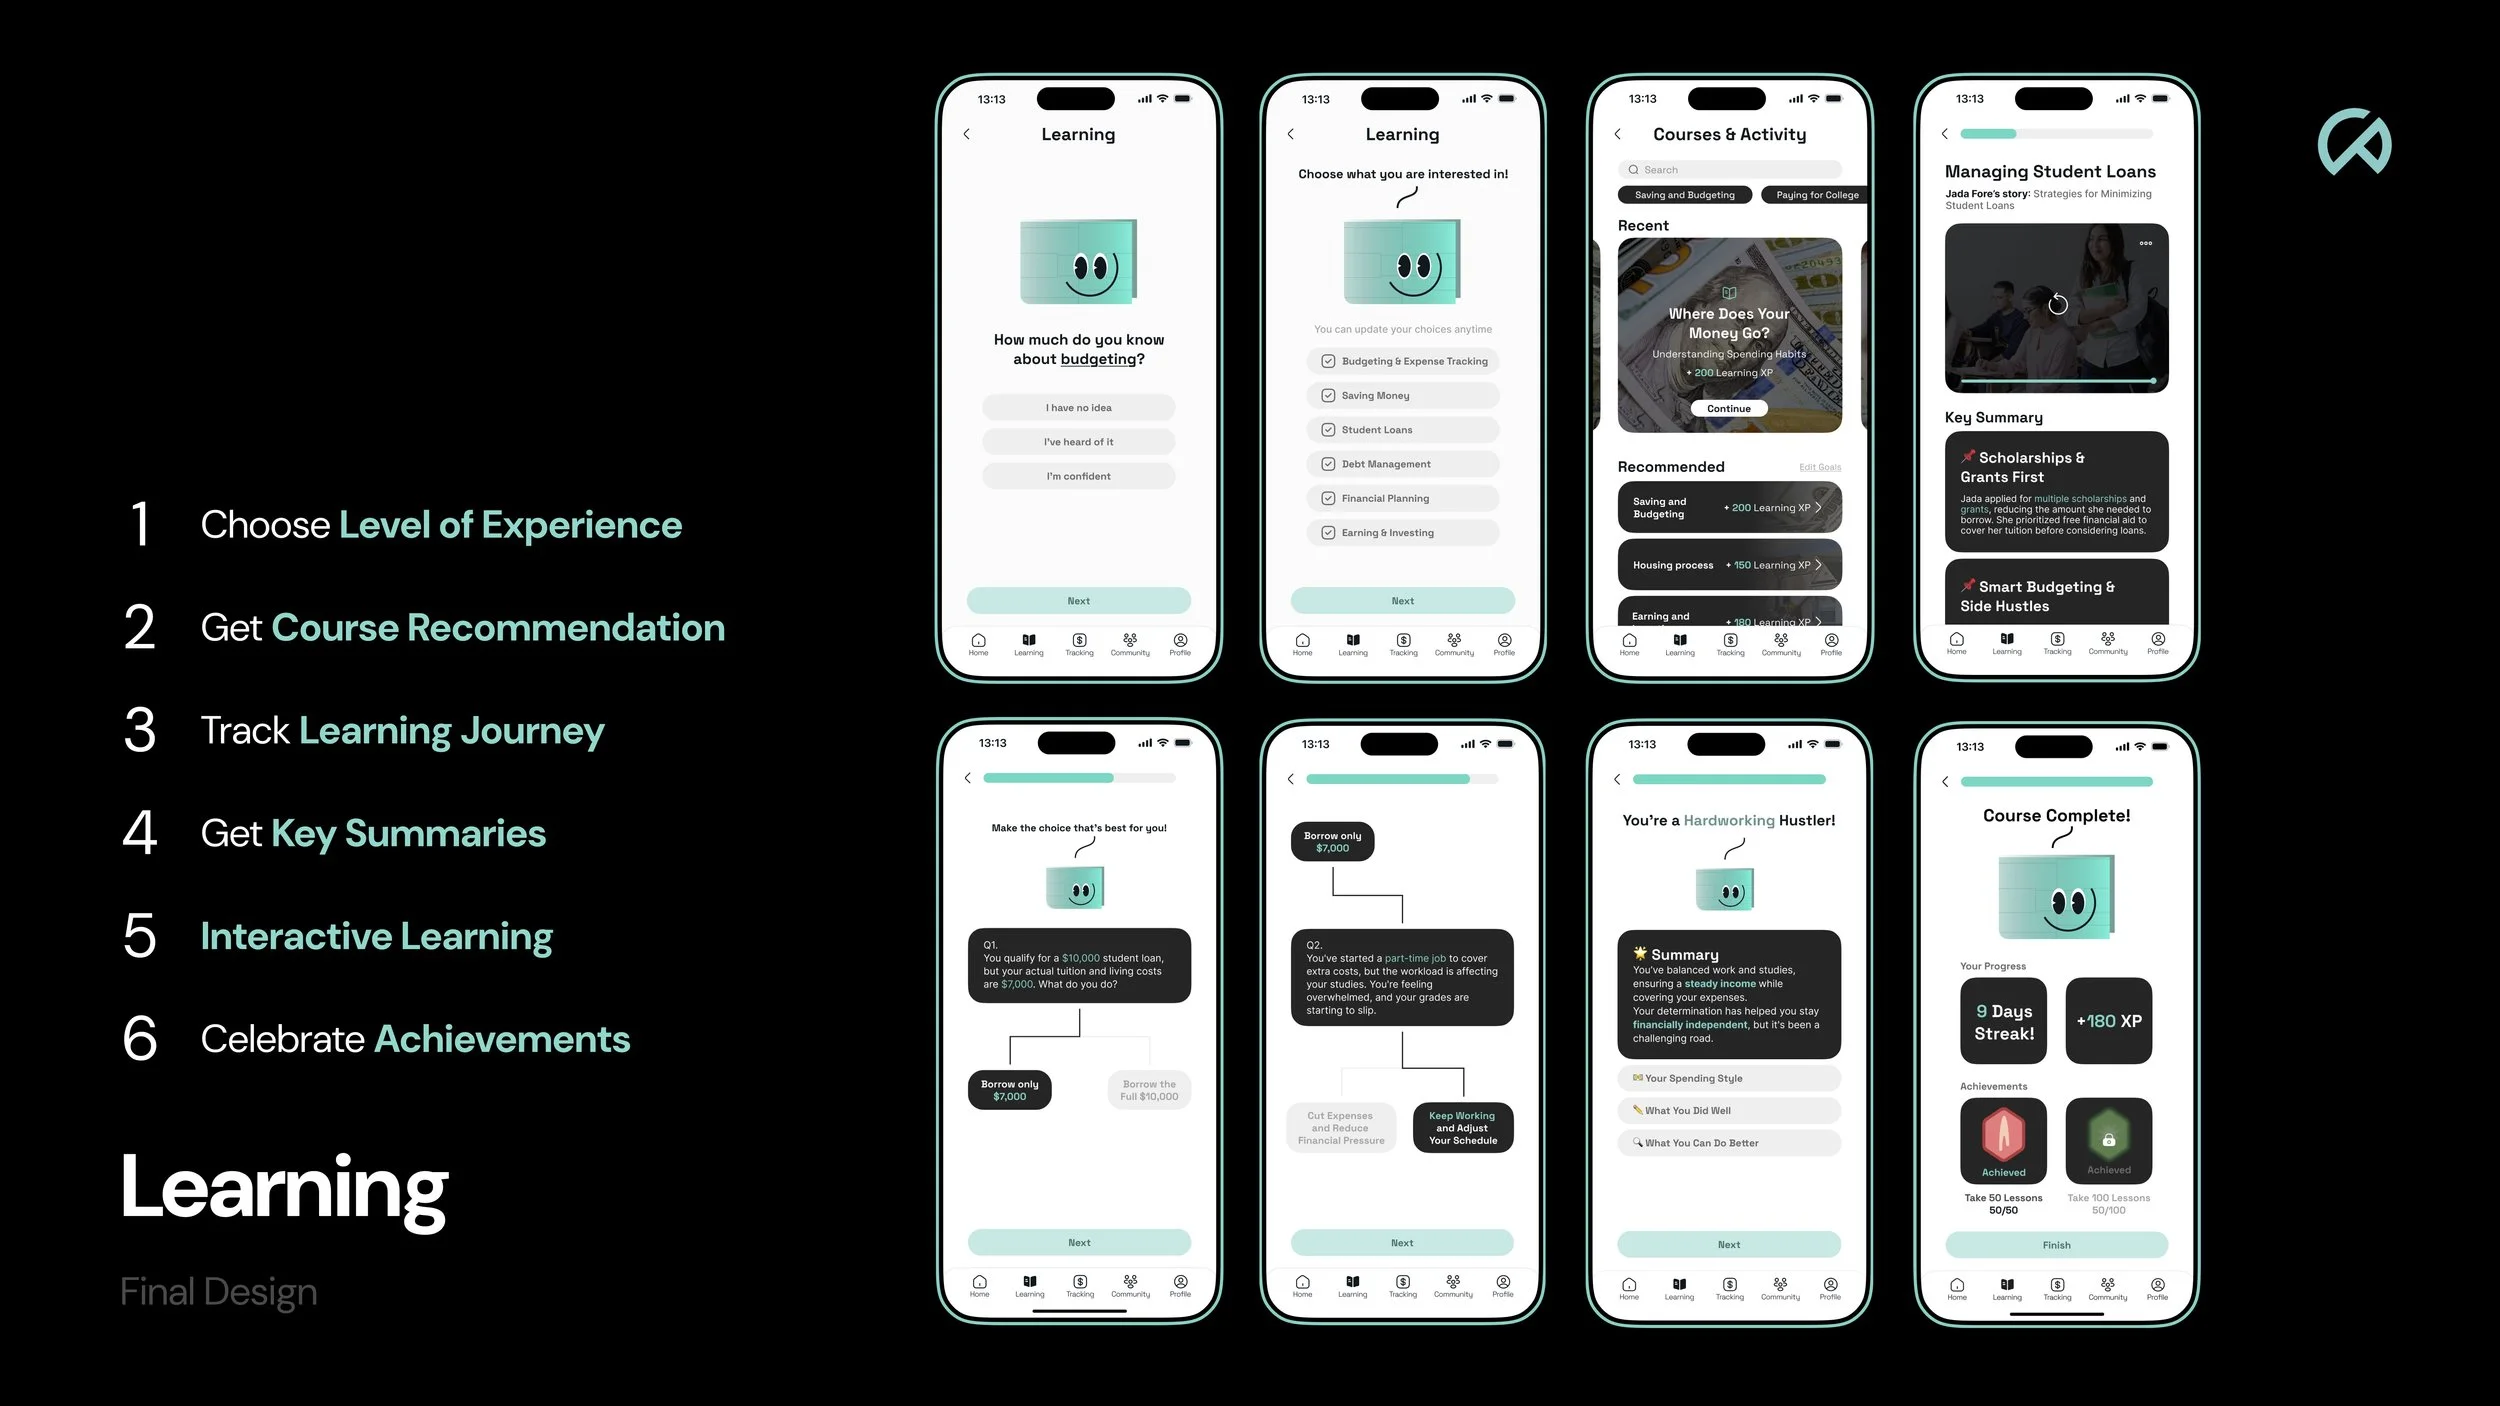
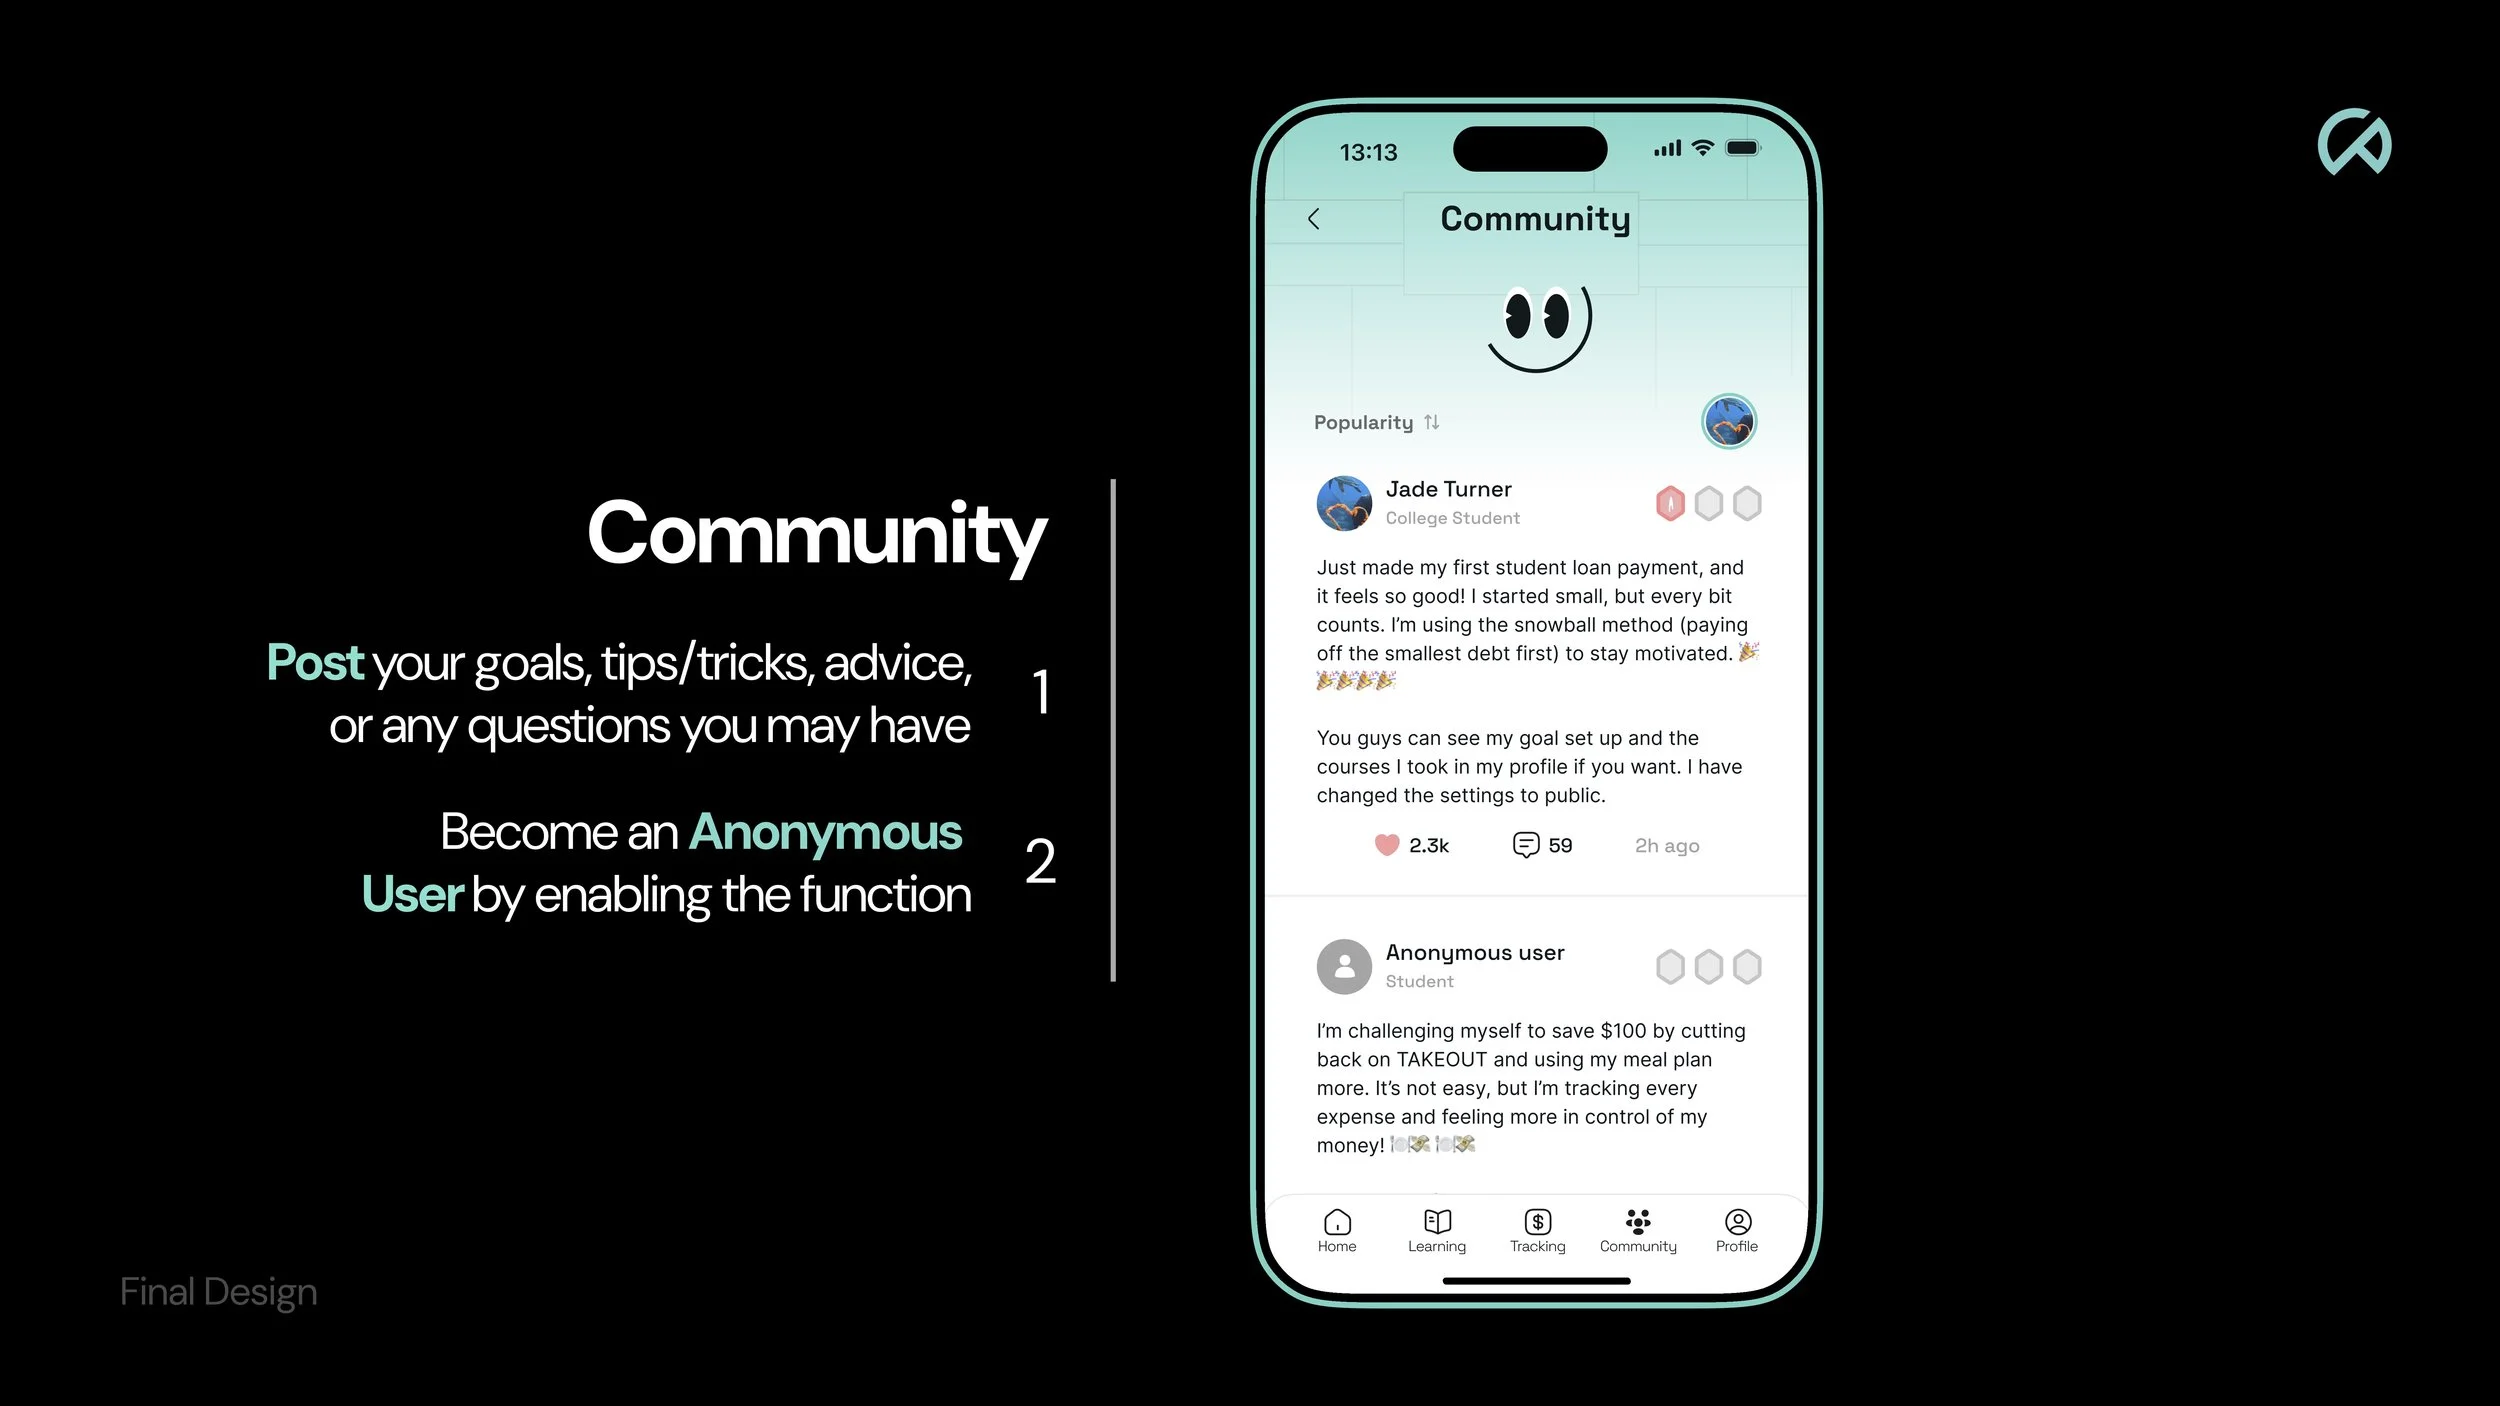
Spera creates an engaging, personalized financially educating environment that simplifies budgeting, saving, and decision-making while catering to varying starting points among college students. It encourages them to practice, learn, and receive support in their journey.

Prototype

Process

Problem Identification
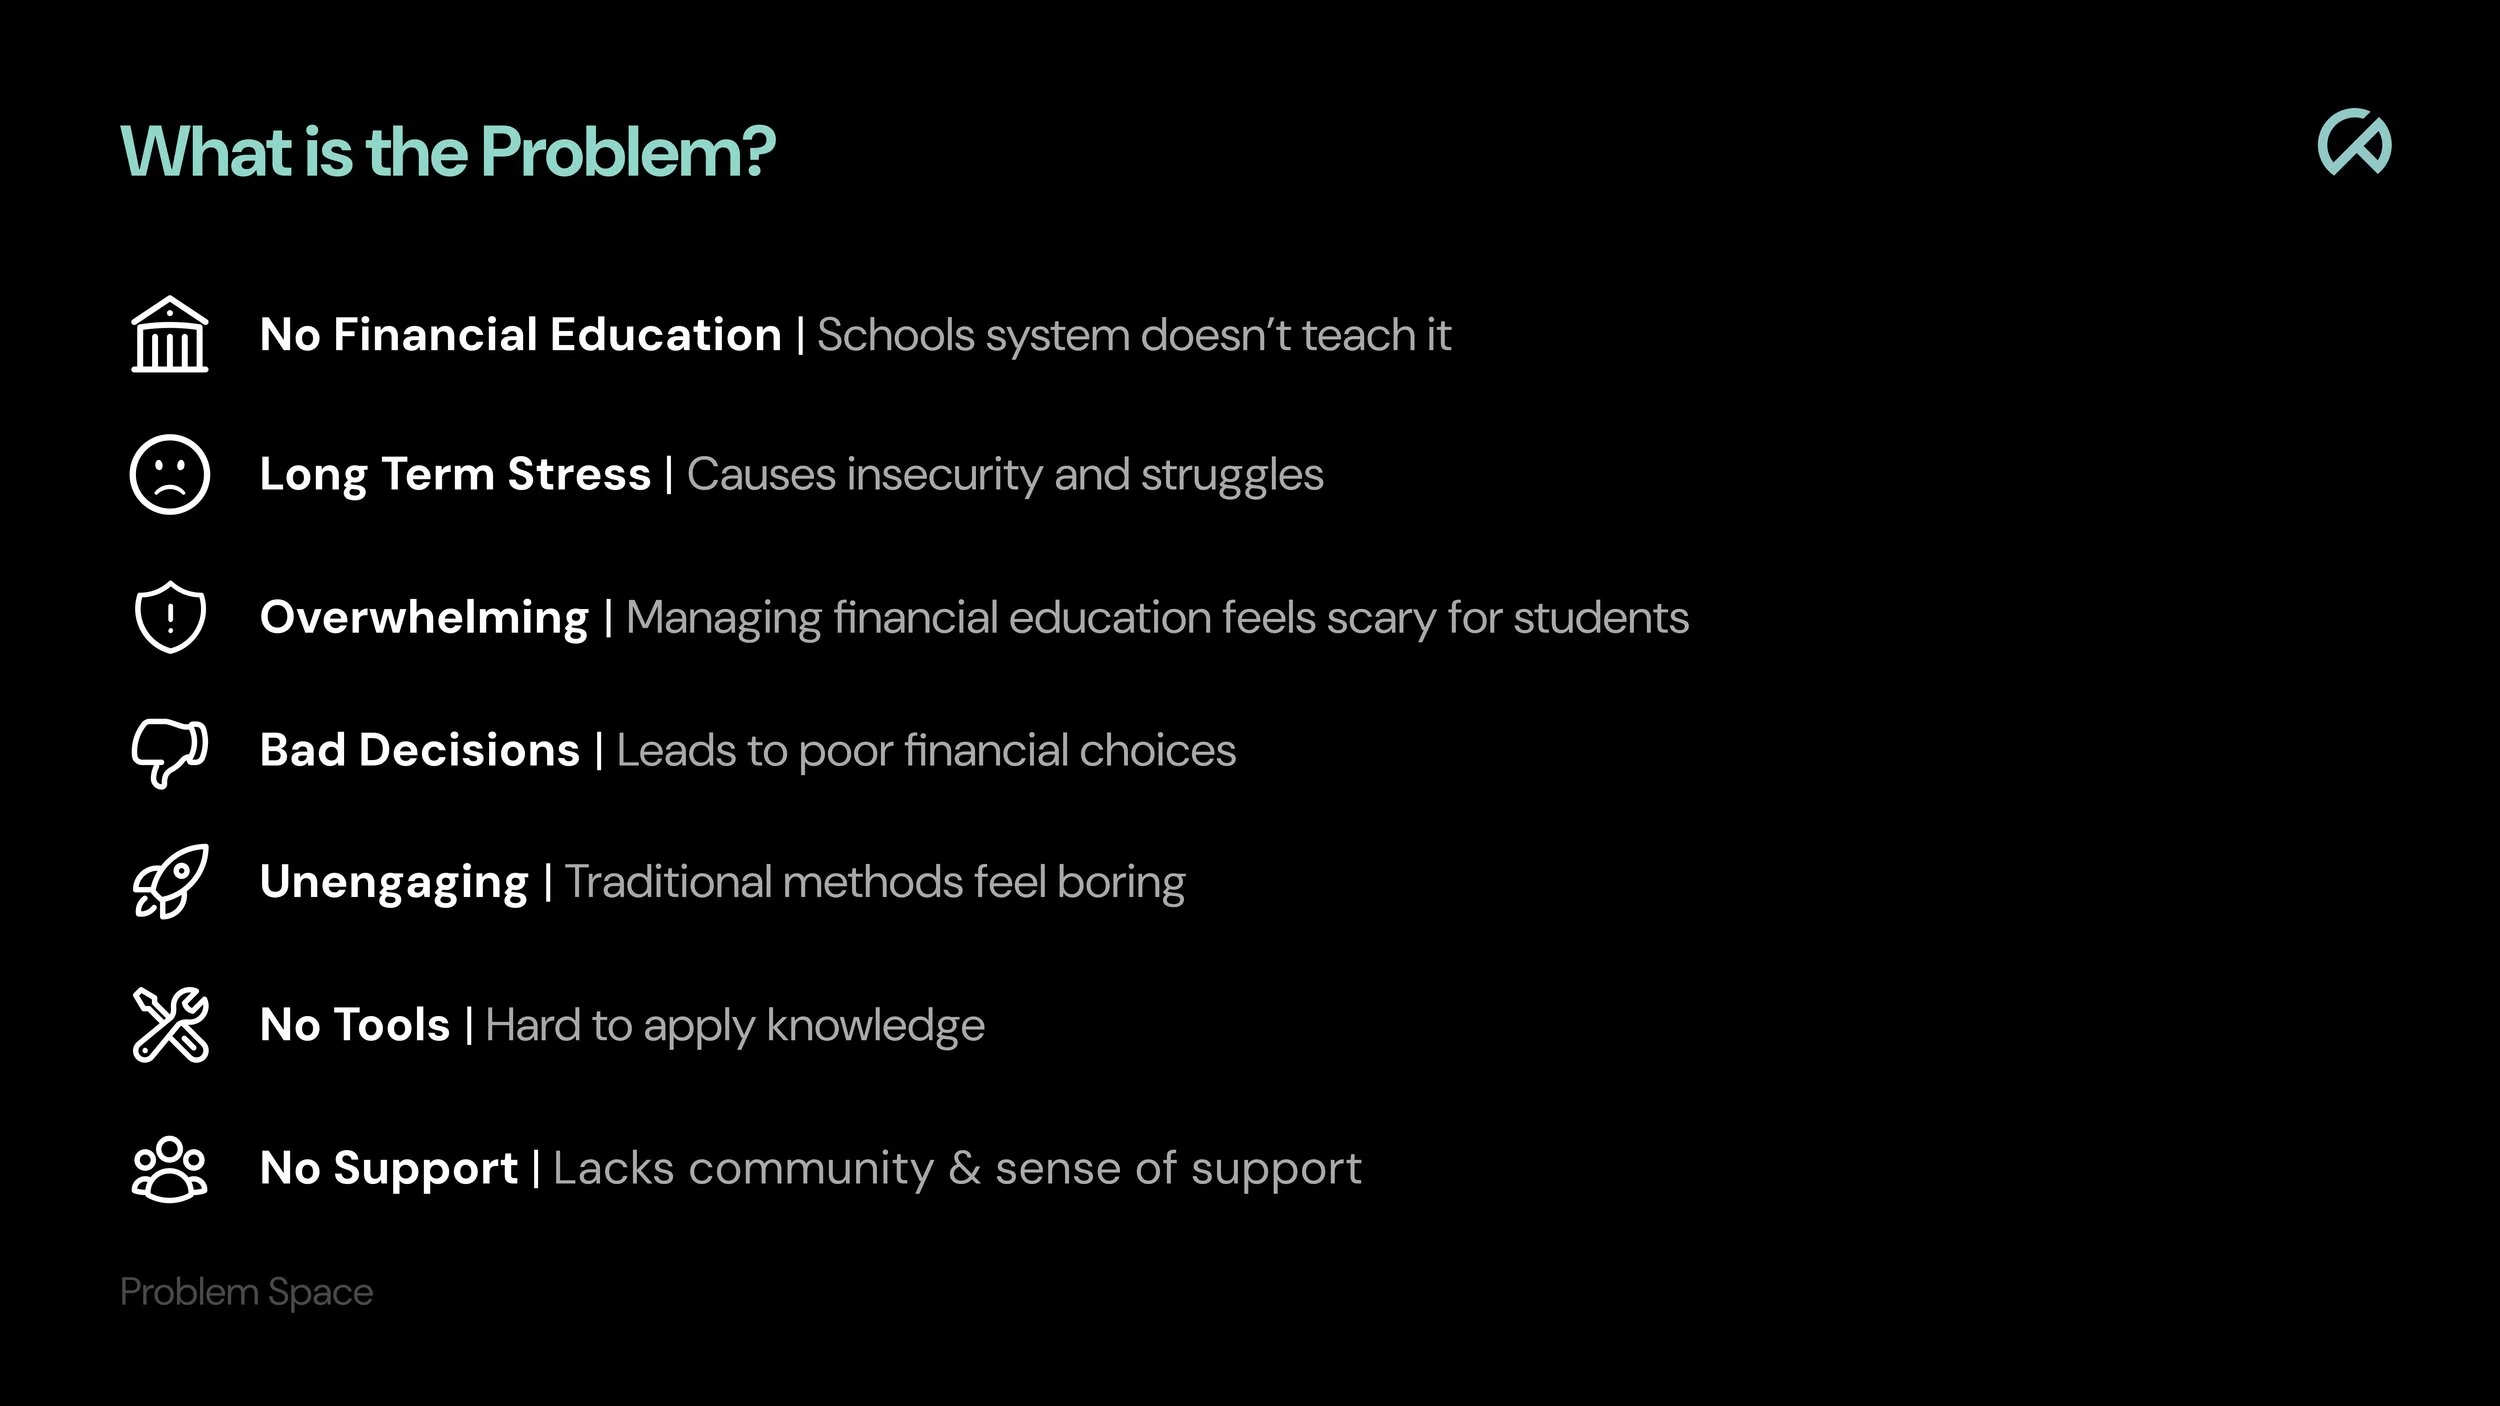
A presentation slide titled 'What is the Problem?' listing issues with financial education for students, including no financial education, long-term stress, overwhelming feeling, bad decisions, unengaging methods, no tools, and no support, each with an icon.
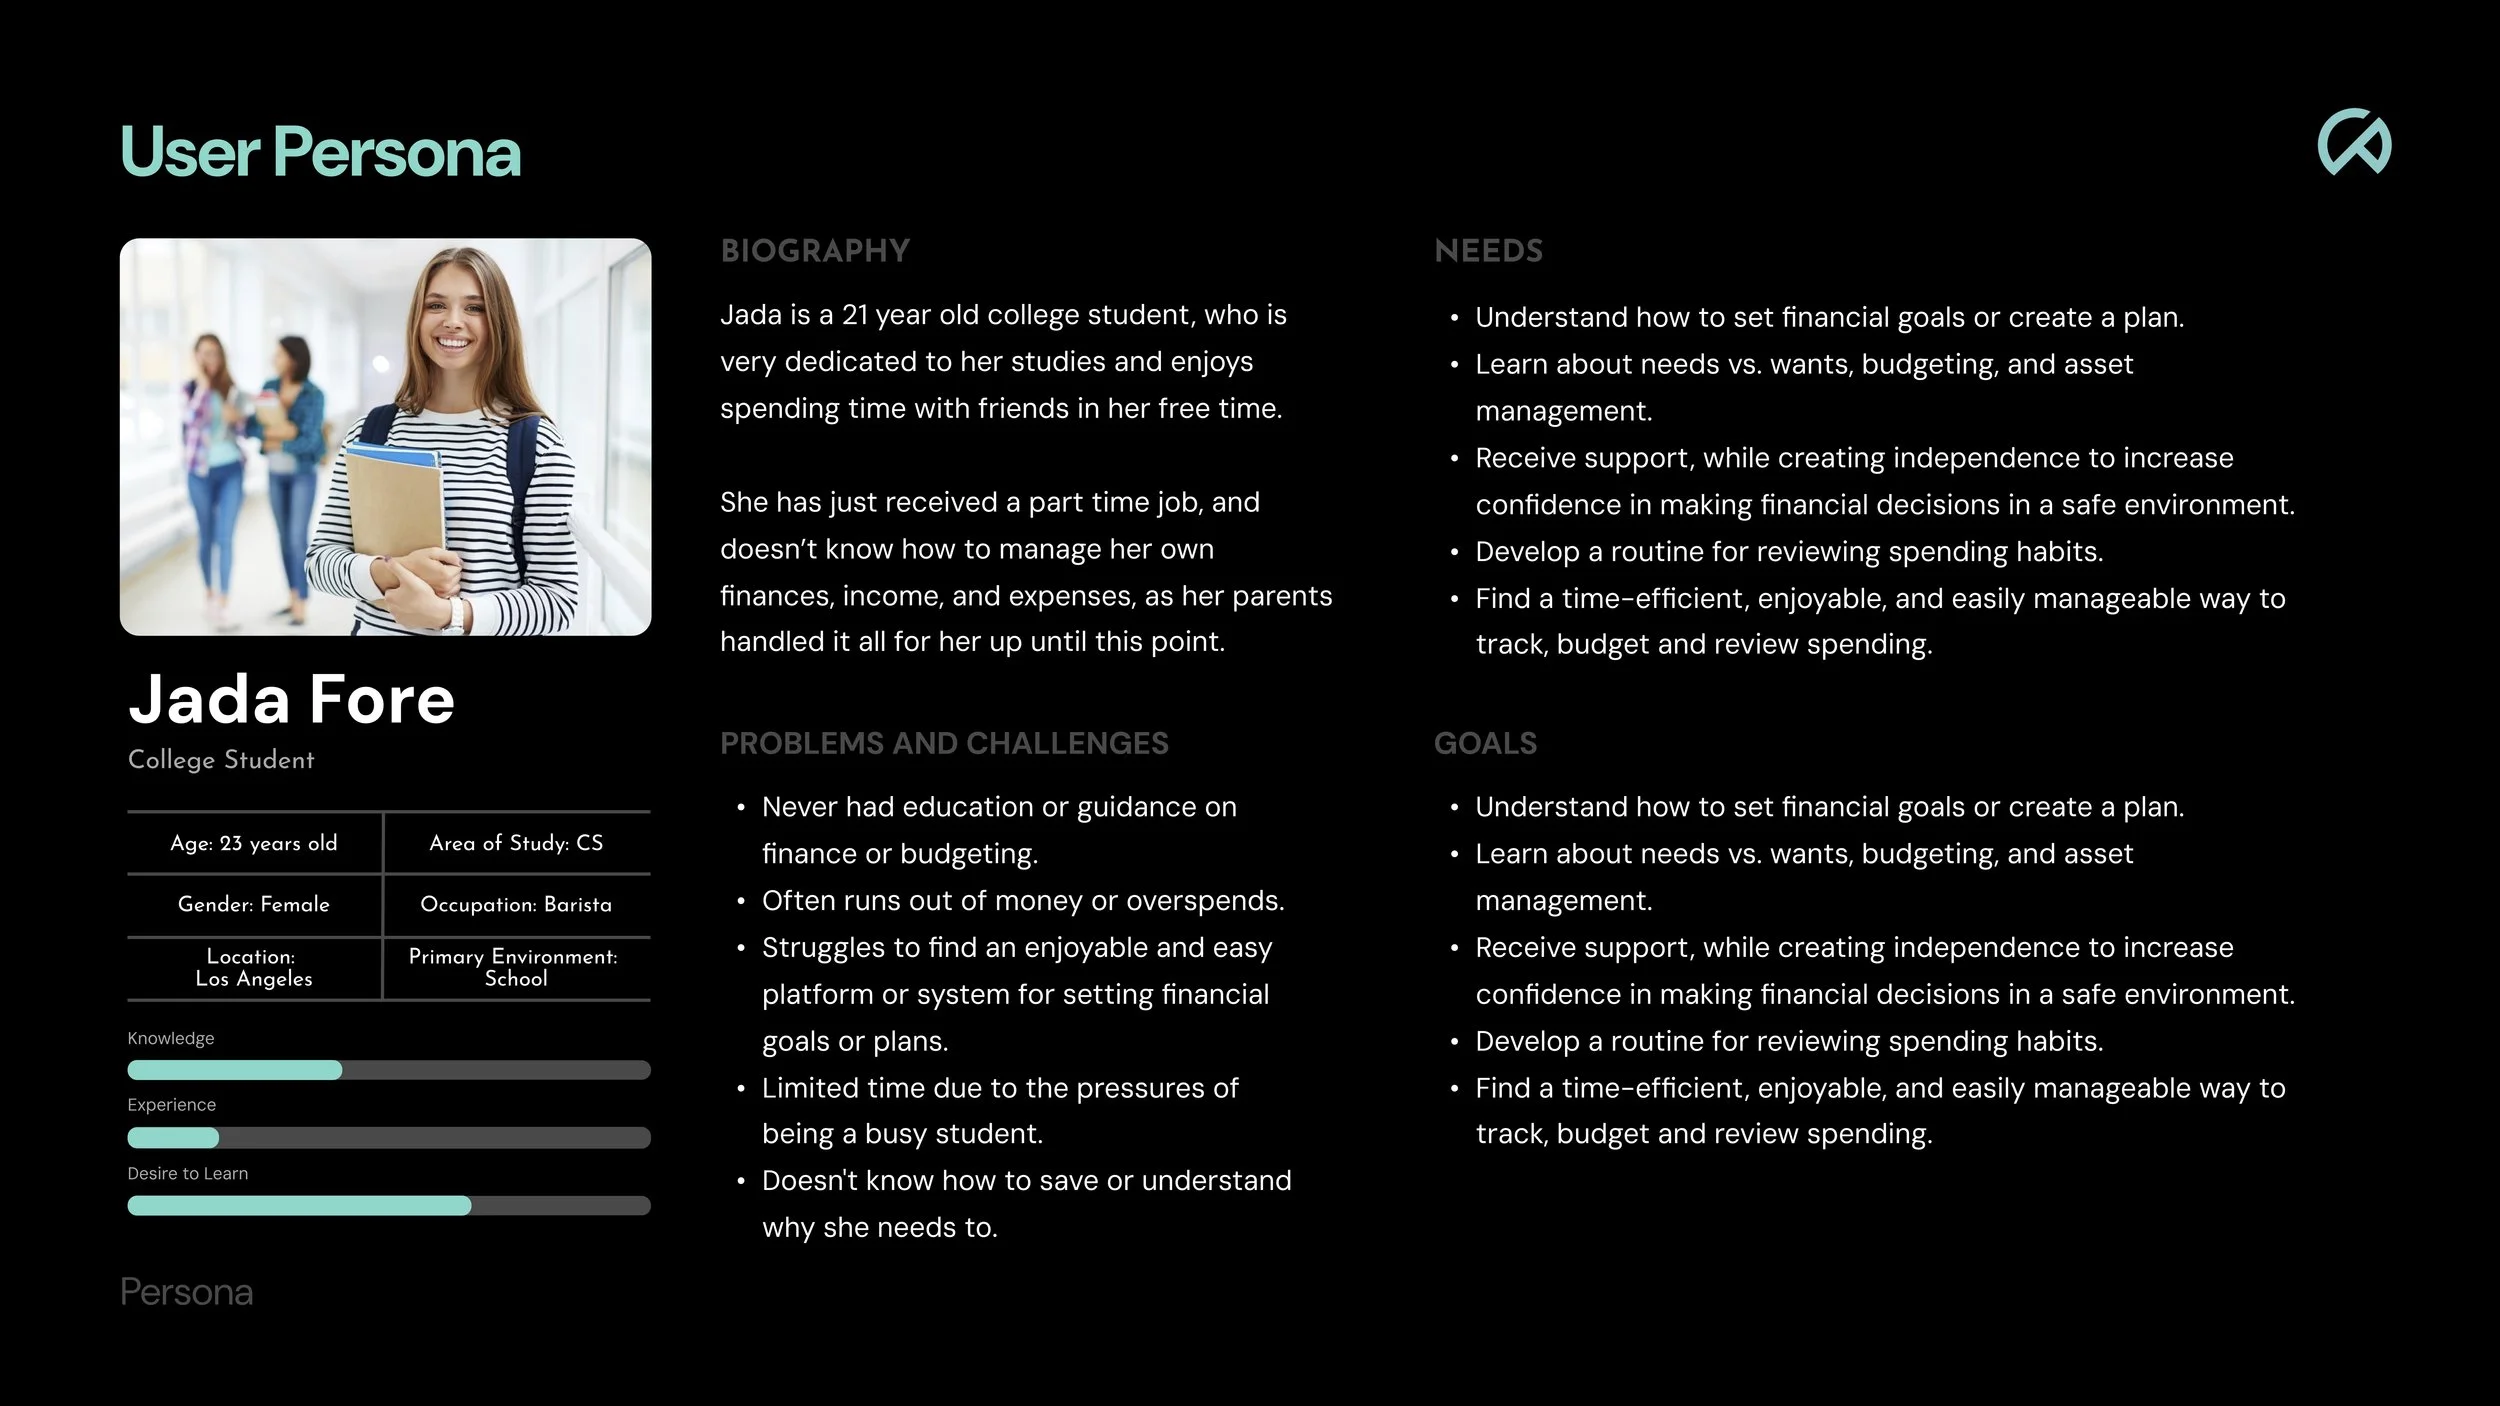
Dark-themed infographic page about a college student named Jada Fore, aged 23, studying computer science in Los Angeles. The infographic includes a photo of Jada smiling, with details on her biography, problems and challenges, needs, goals, and a skill progress chart for knowledge, experience, and desire to learn.
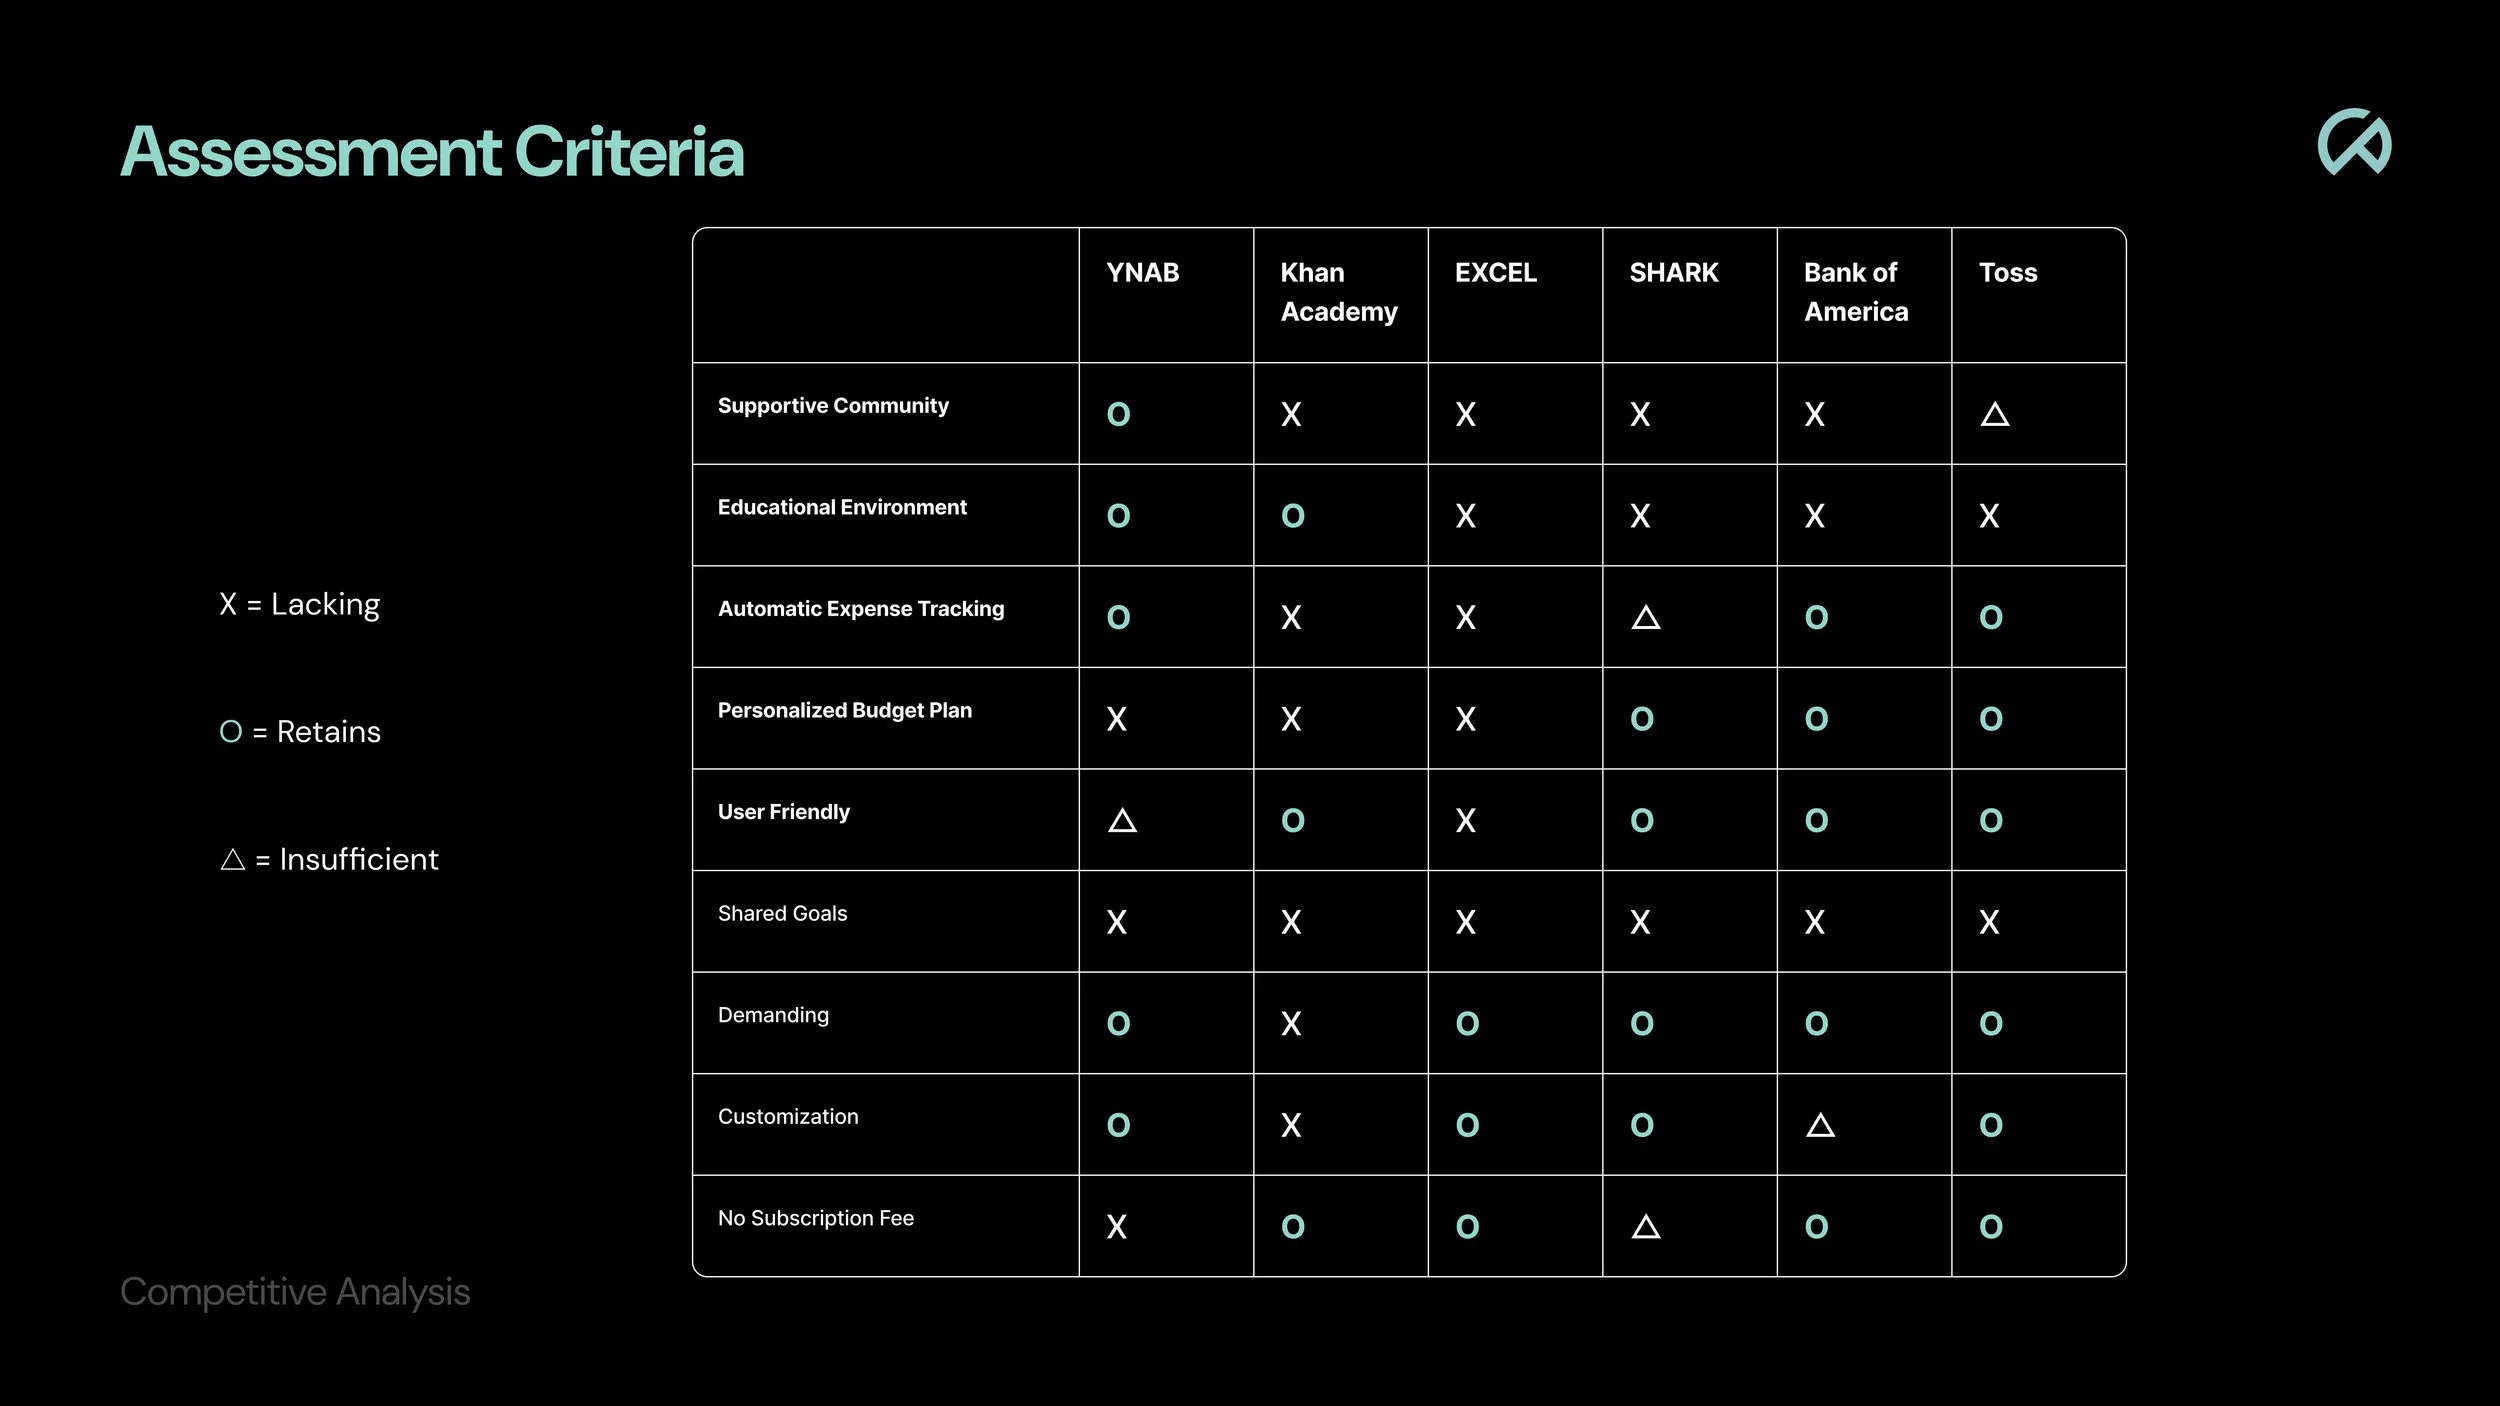
A black background image with a table showing assessment criteria and the companies YMCA, Khan Academy, Excel, Shark, Bank of America, and Toss, with ratings indicated by symbols: circles for retails, X's for lacking, triangles for insufficient, and circles for retention.
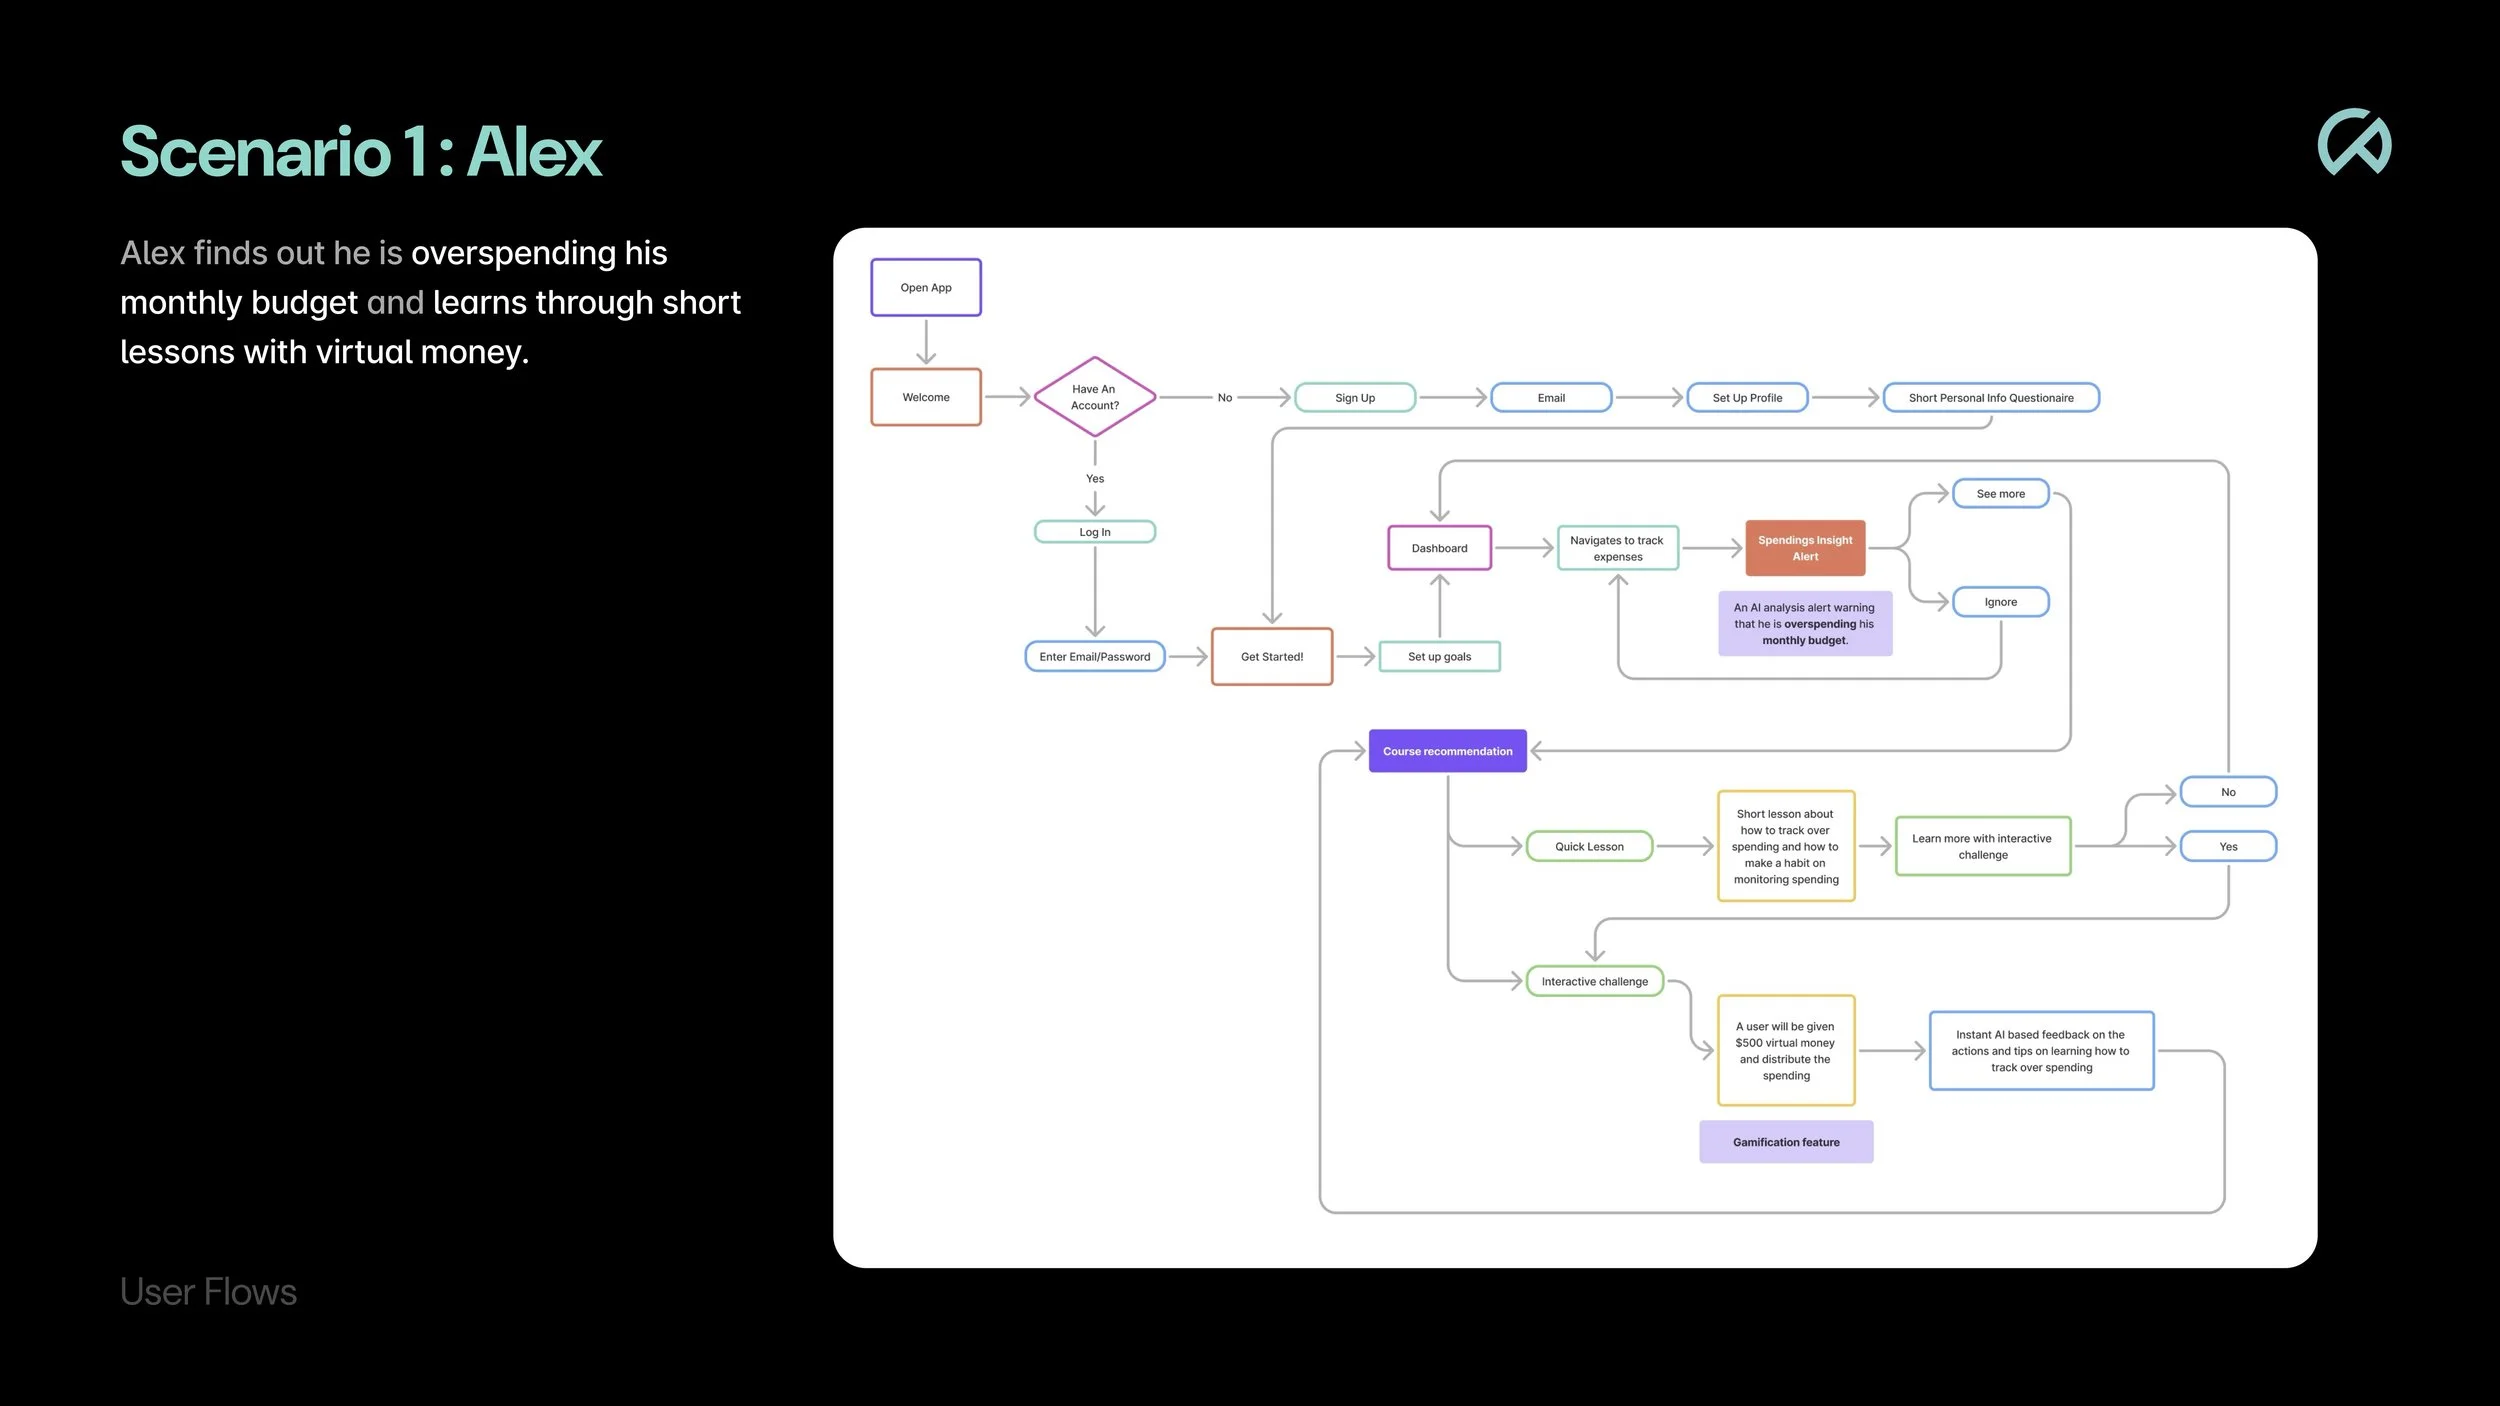
Flowchart diagram titled 'User Flows' illustrating a process for managing overspending through an app, with steps including welcome, login, dashboard, expense tracking, alerts, and interactive challenges.
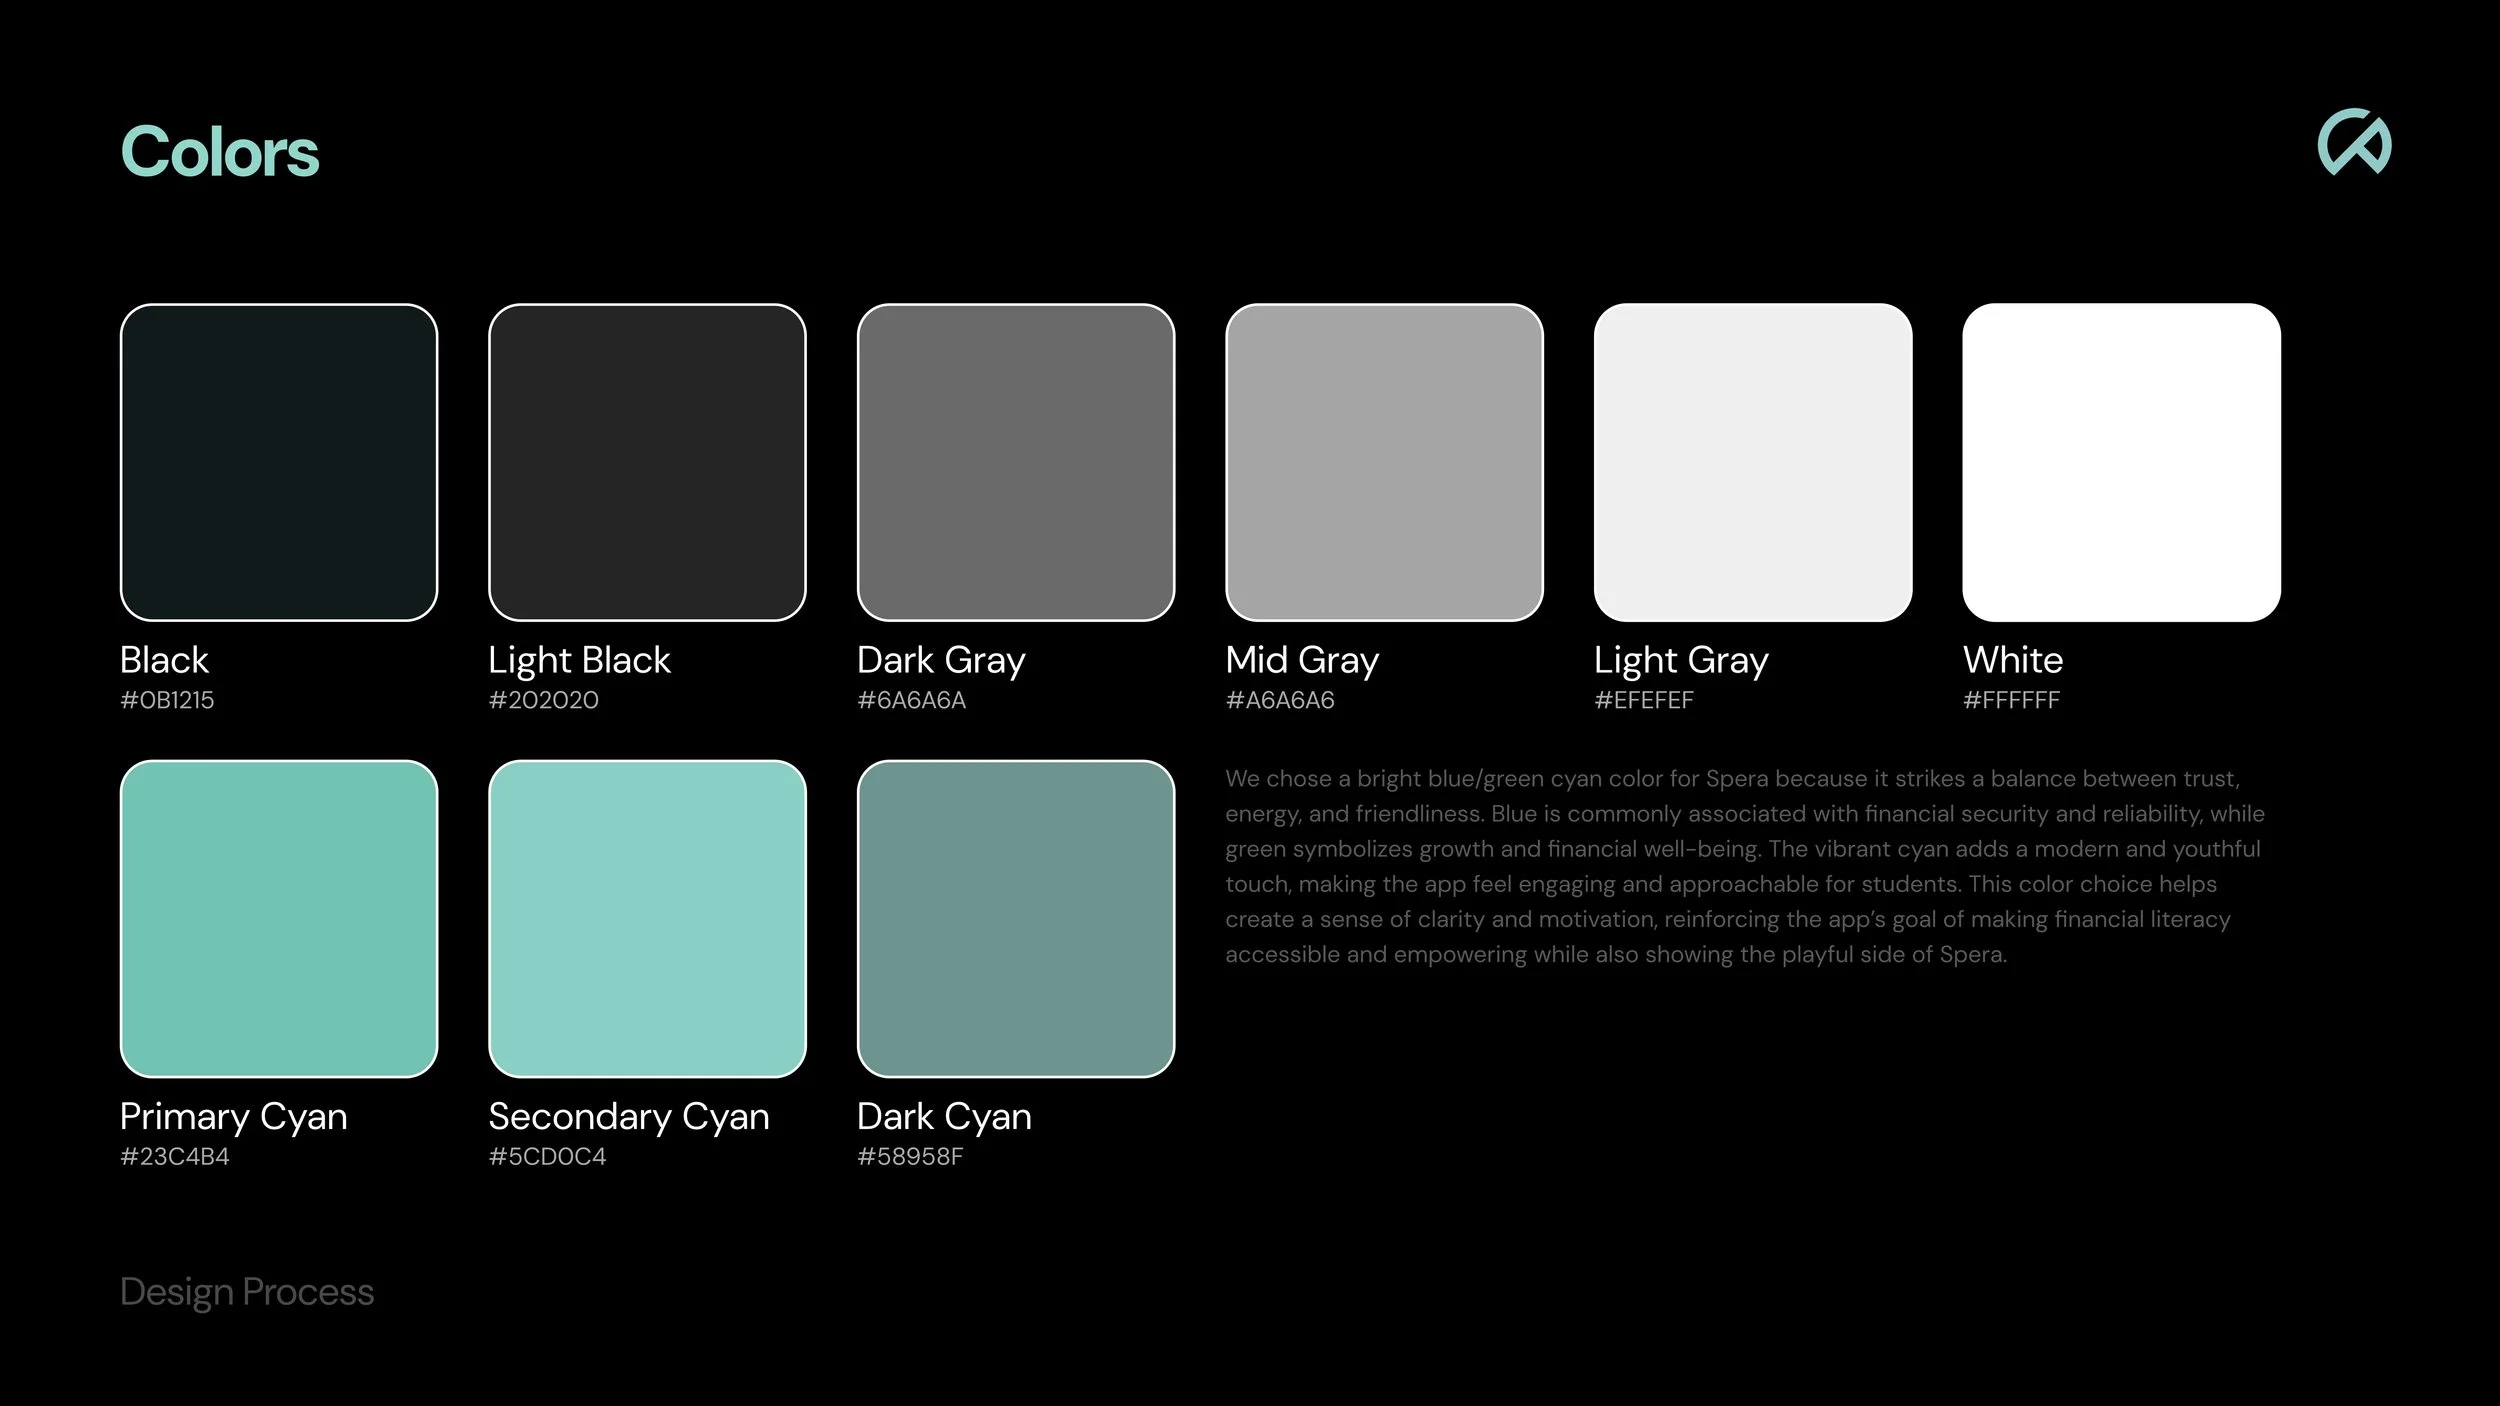
A digital color palette with various shades of black, gray, white, cyan, and dark cyan, each labeled with its name and hex code, and a description of the color selection process for an app design.
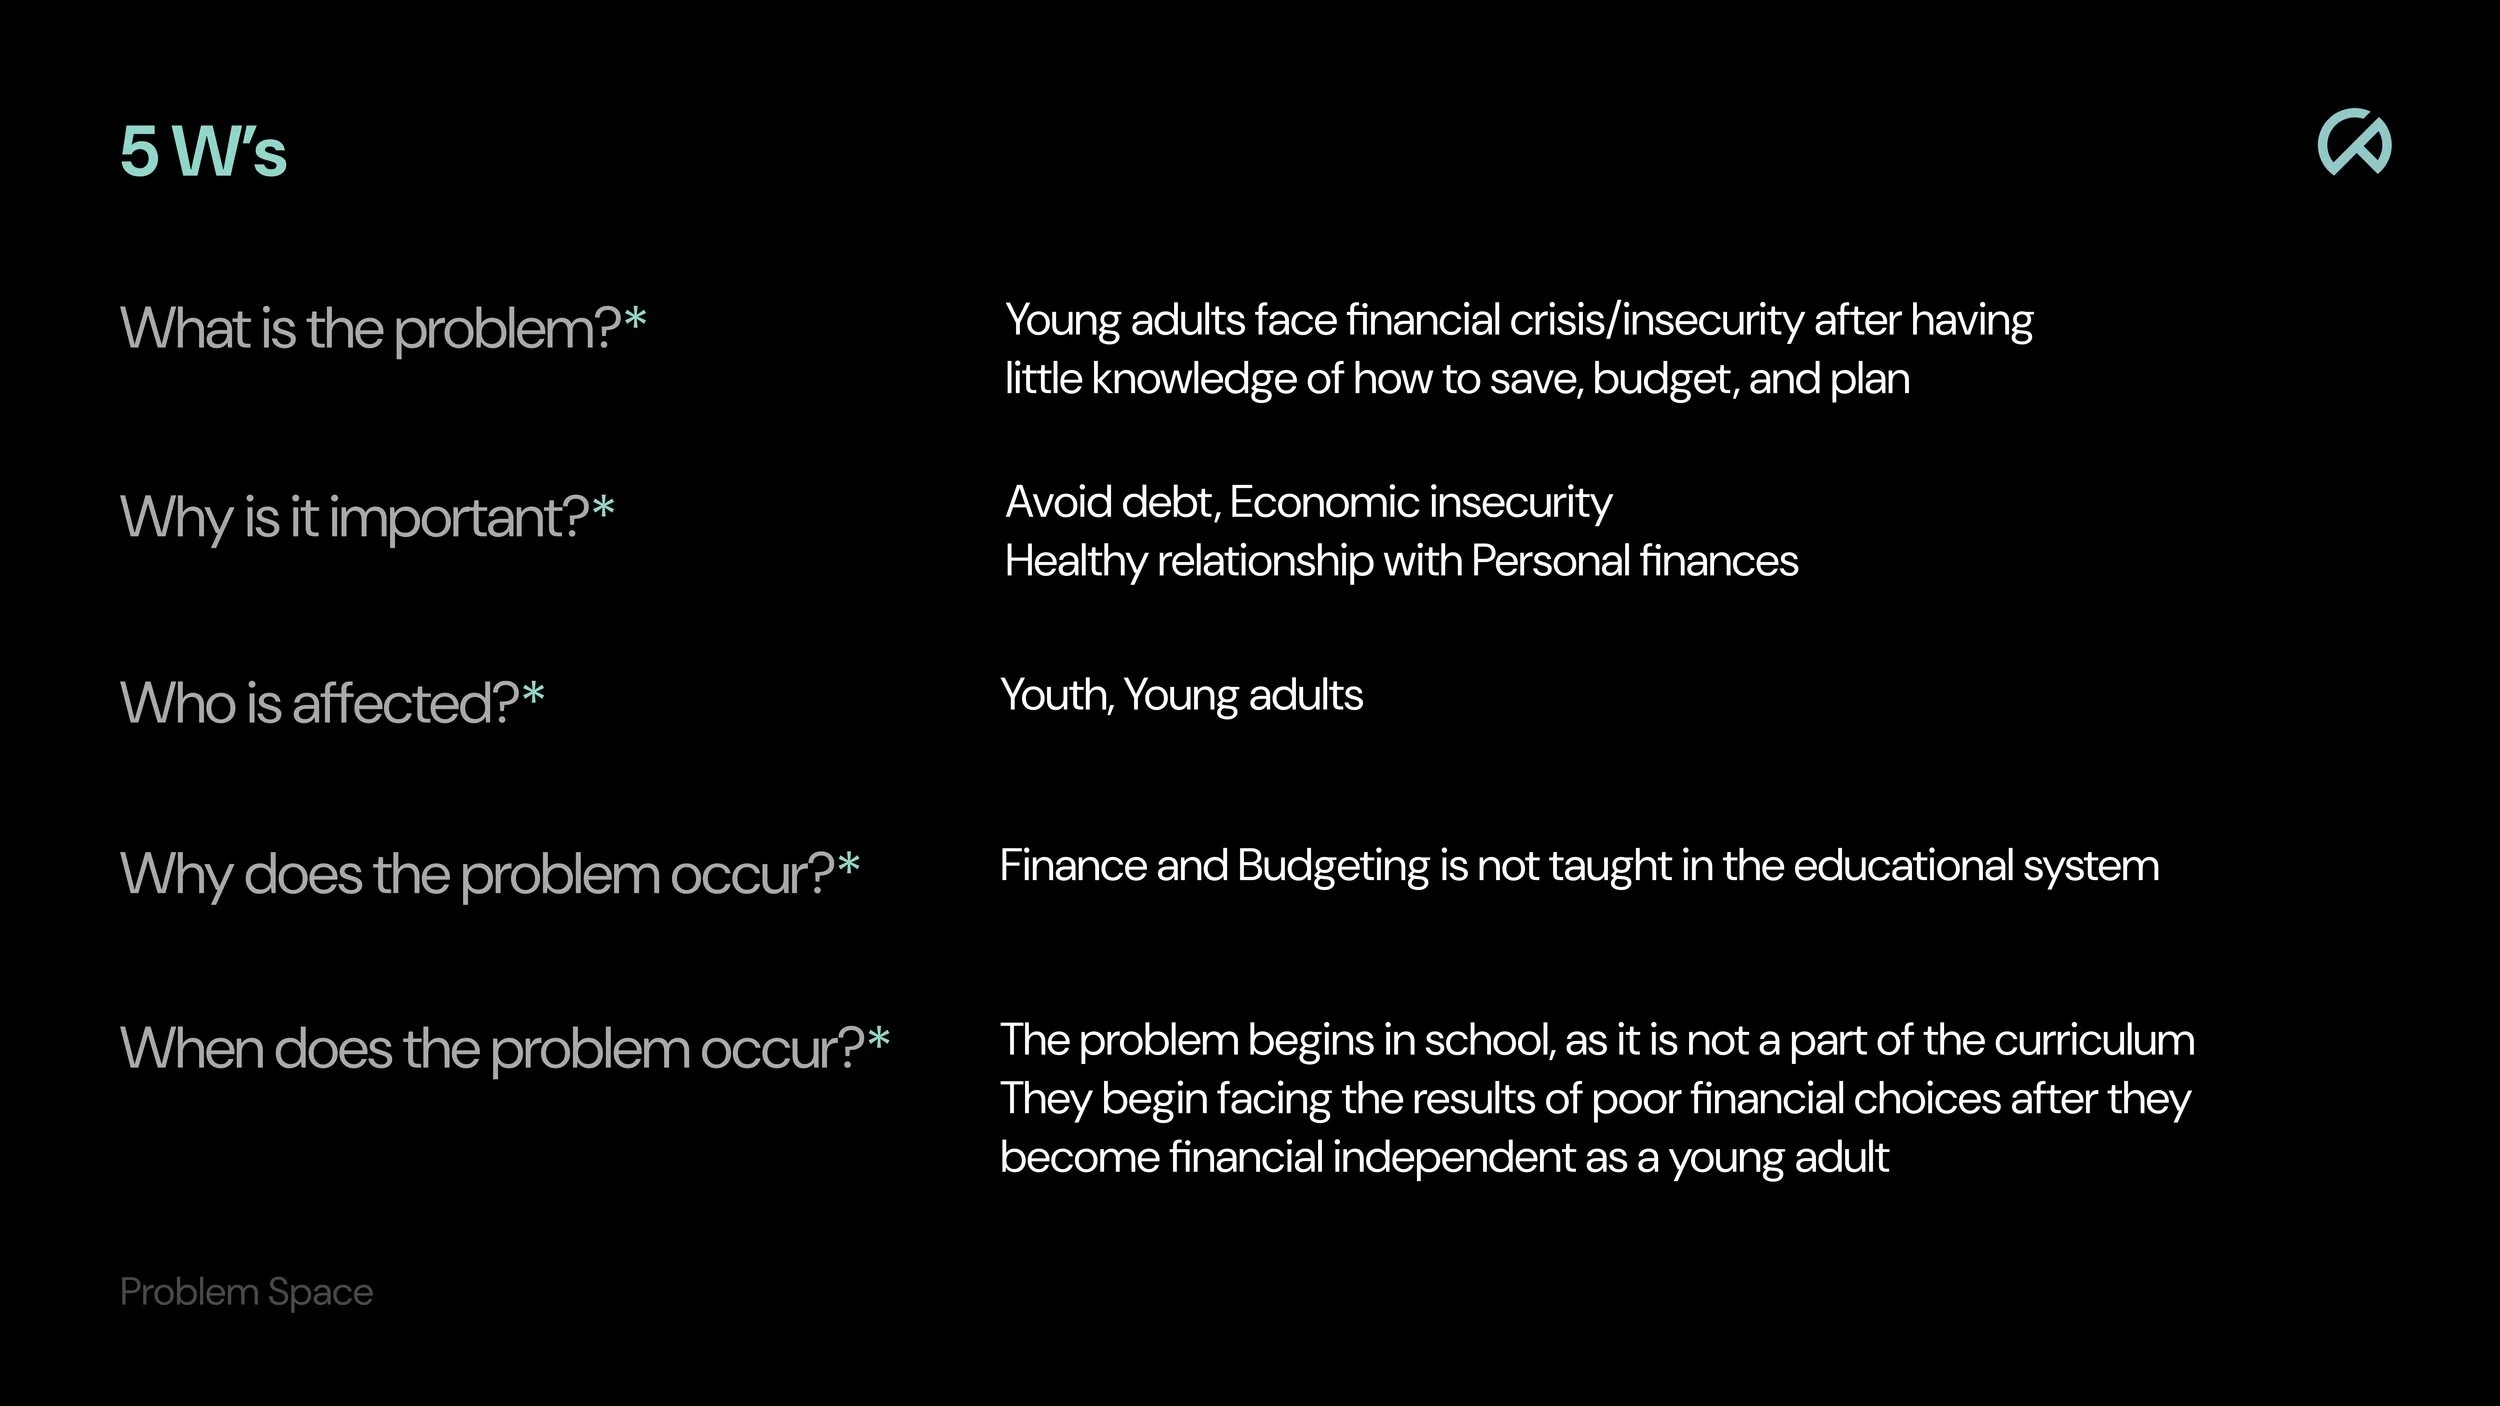
Educational infographic titled '5 W's' with questions and answers about youth financial literacy, including 'What is the problem?', 'Why is it important?', 'Who is affected?', 'Why does the problem occur?', and 'When does the problem occur?'. The text discusses financial crisis, insecurity, and lack of education in personal finance, impacting youth and young adults.
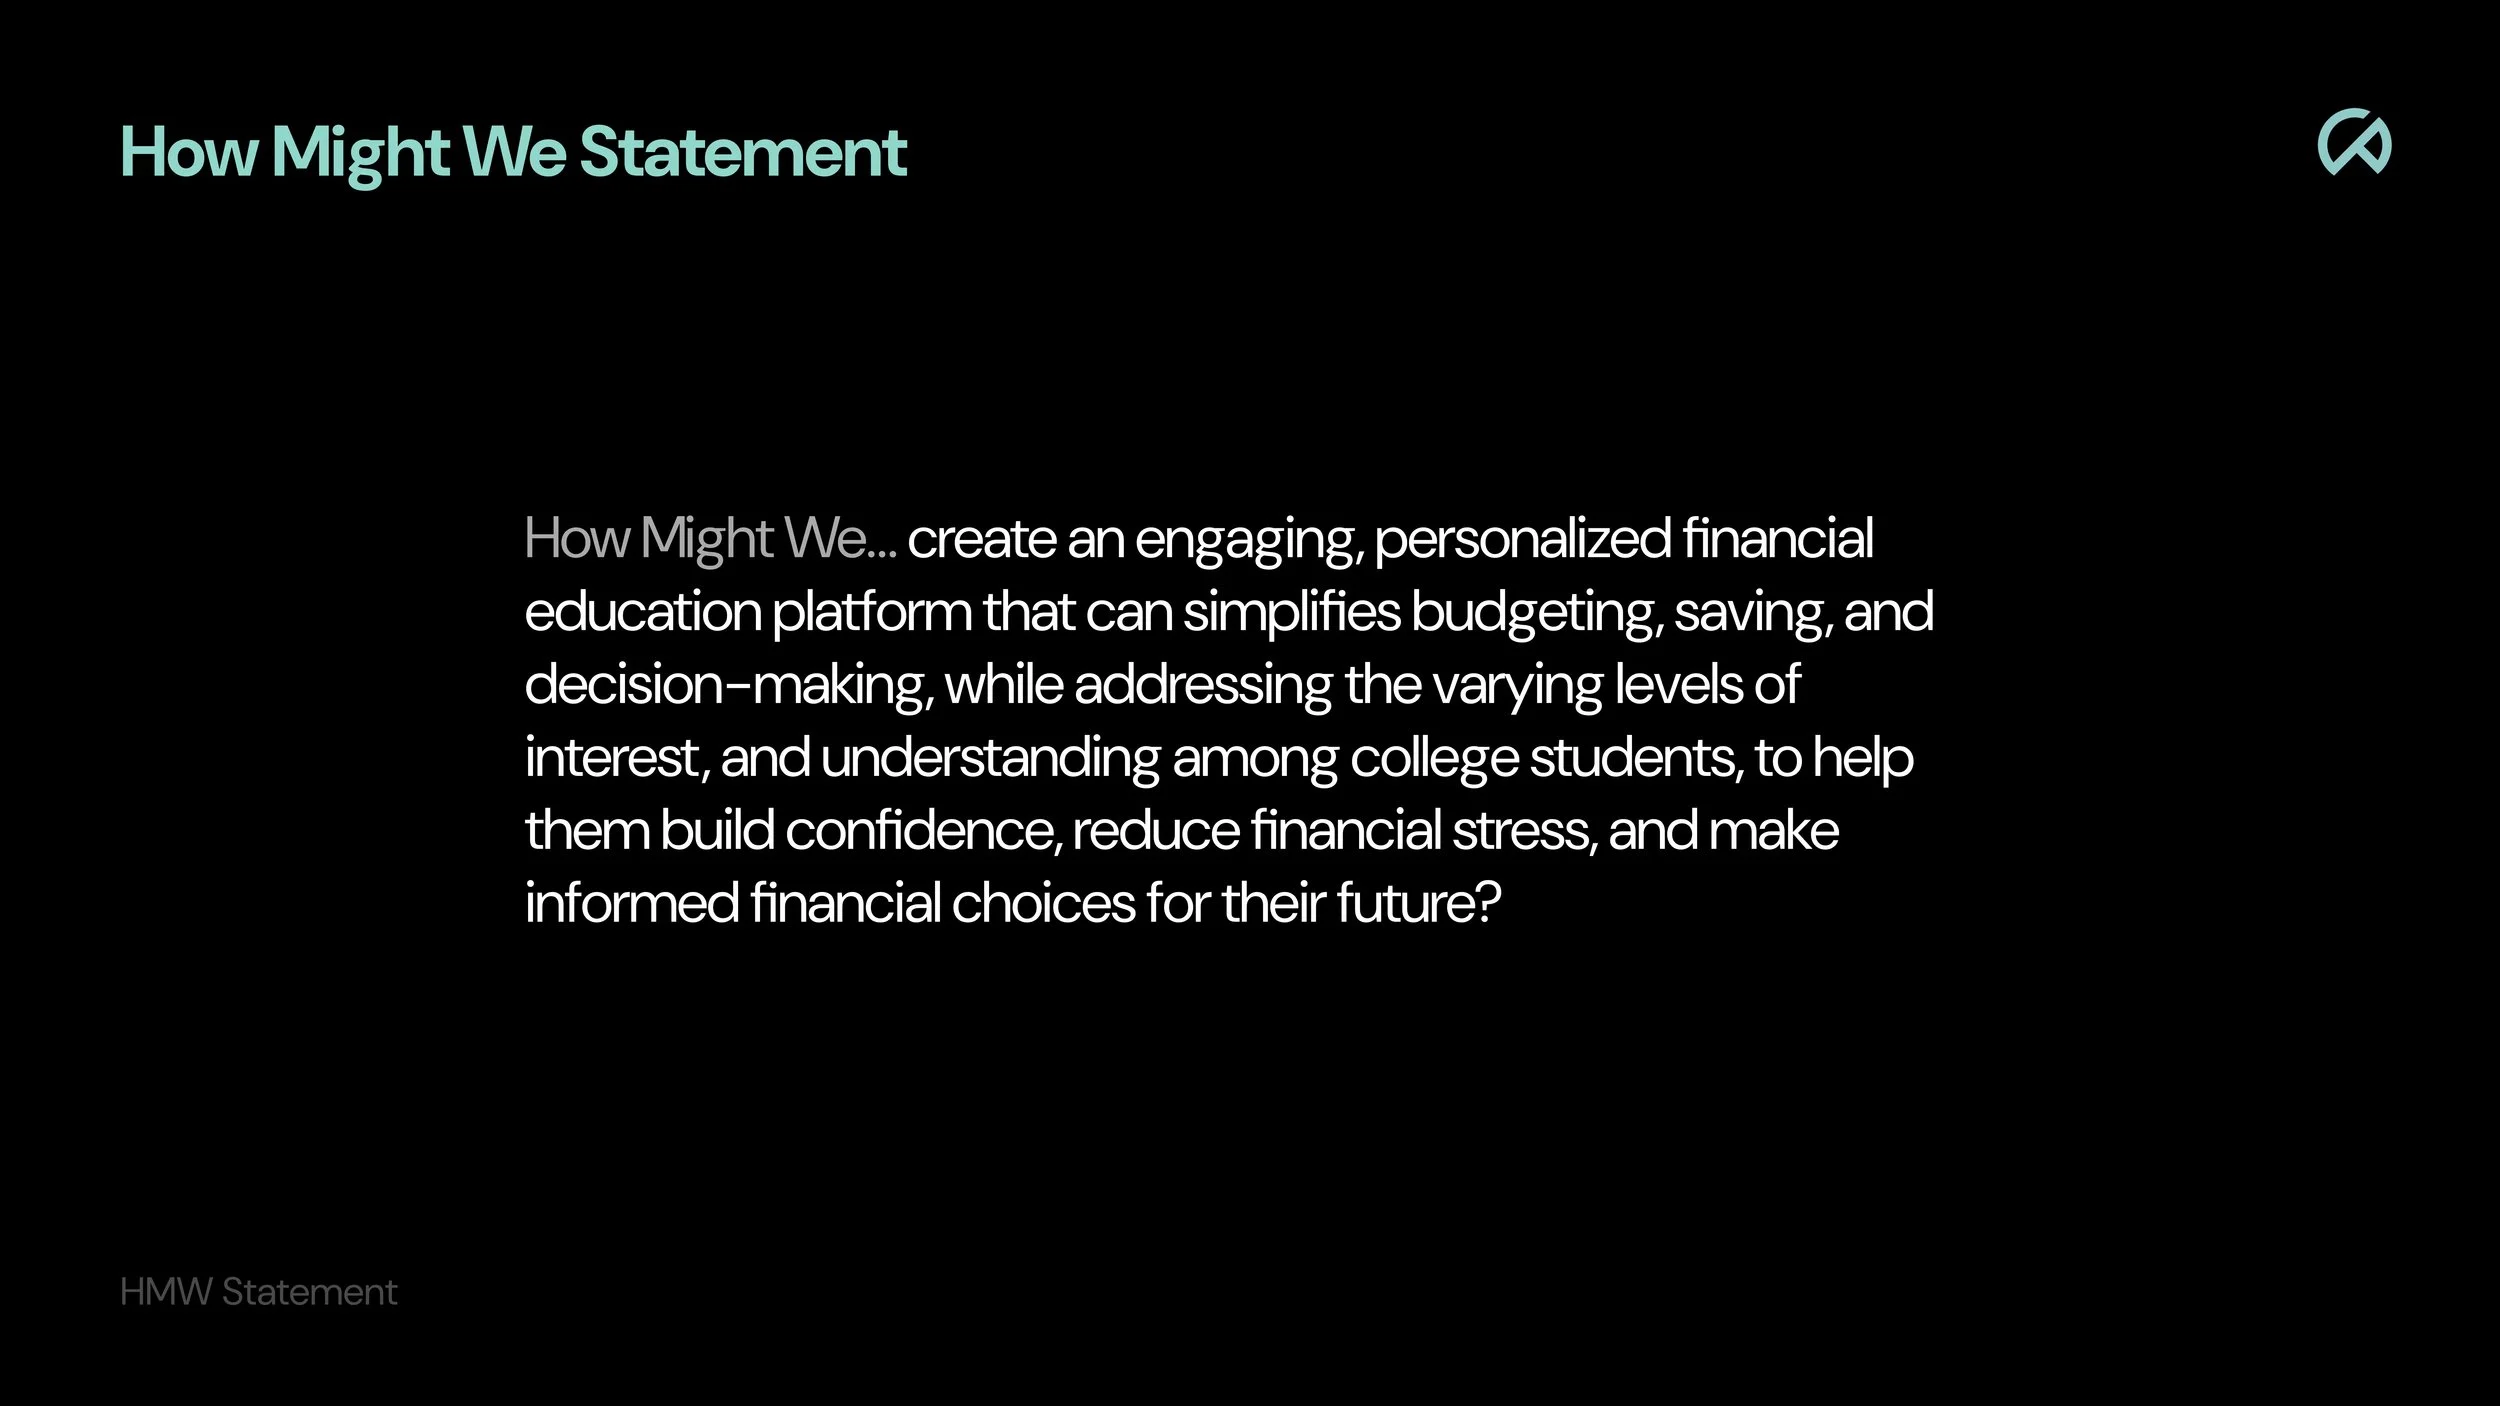
A black slide with the title 'How Might We Statement' in large turquoise text and a paragraph in white discussing creating an engaging financial education platform for college students to build confidence, reduce stress, and make informed financial choices.

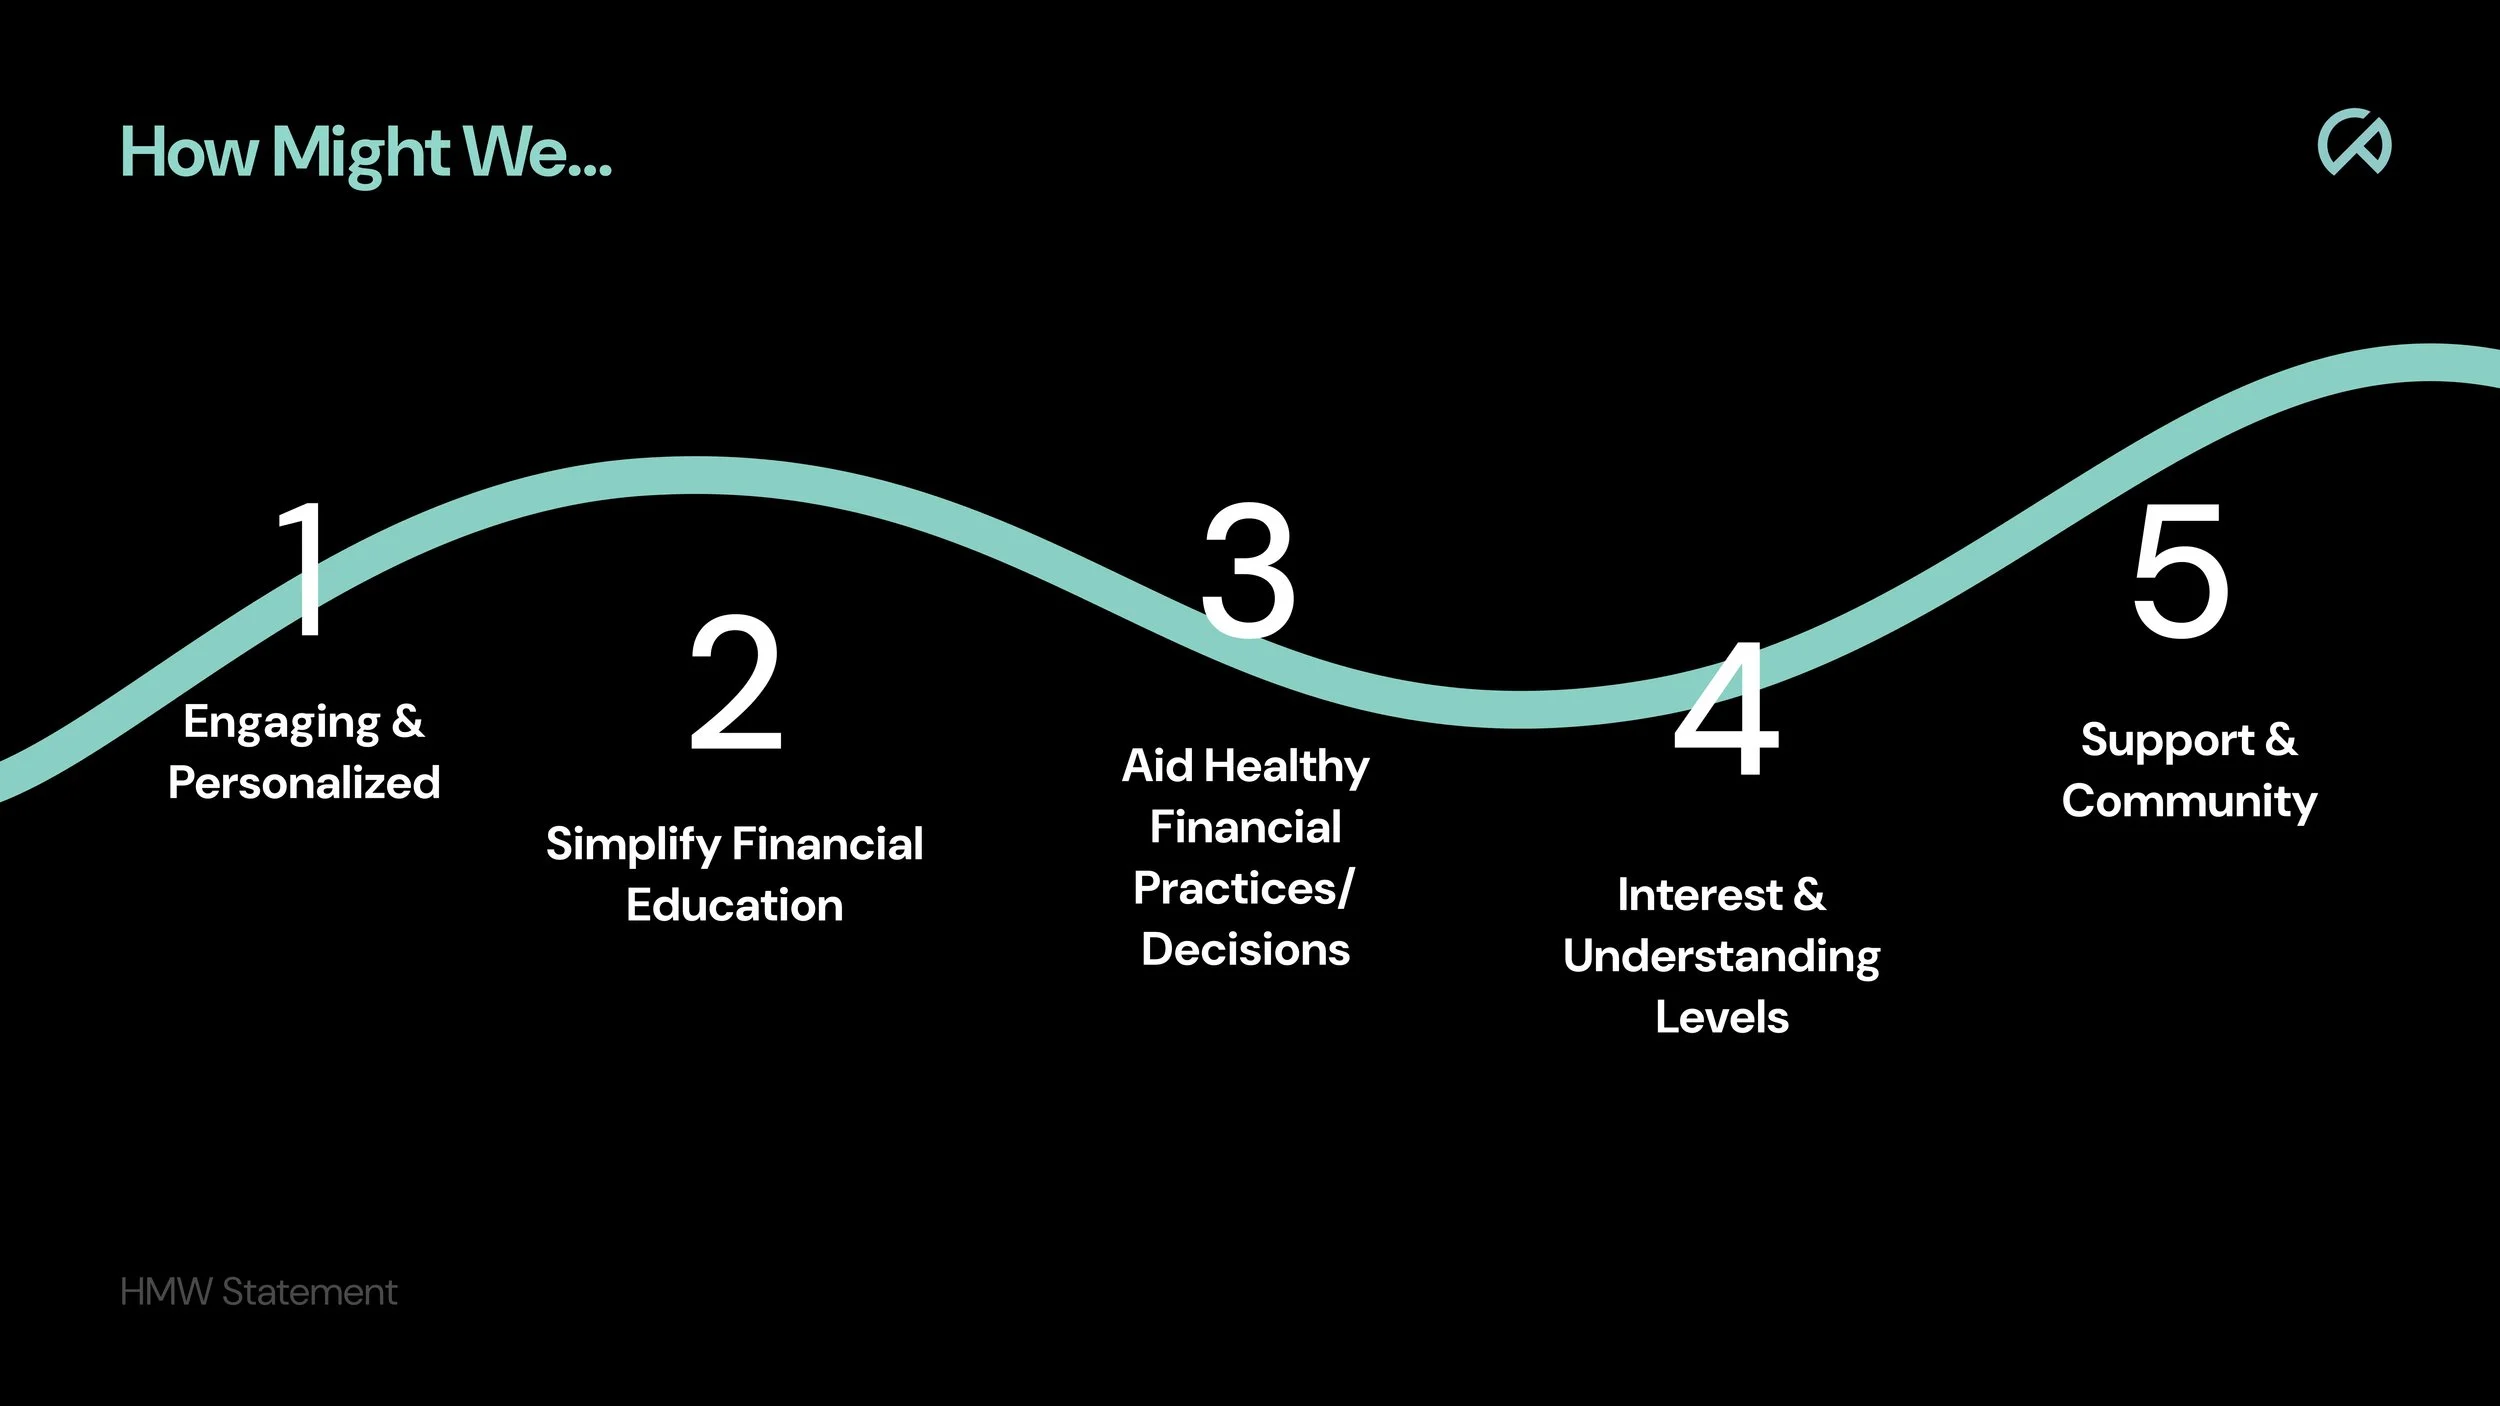
We identified the problem space in which we then brainstormed improvement areas by asking ourselves how might we solve the problems that are encountered.

Research
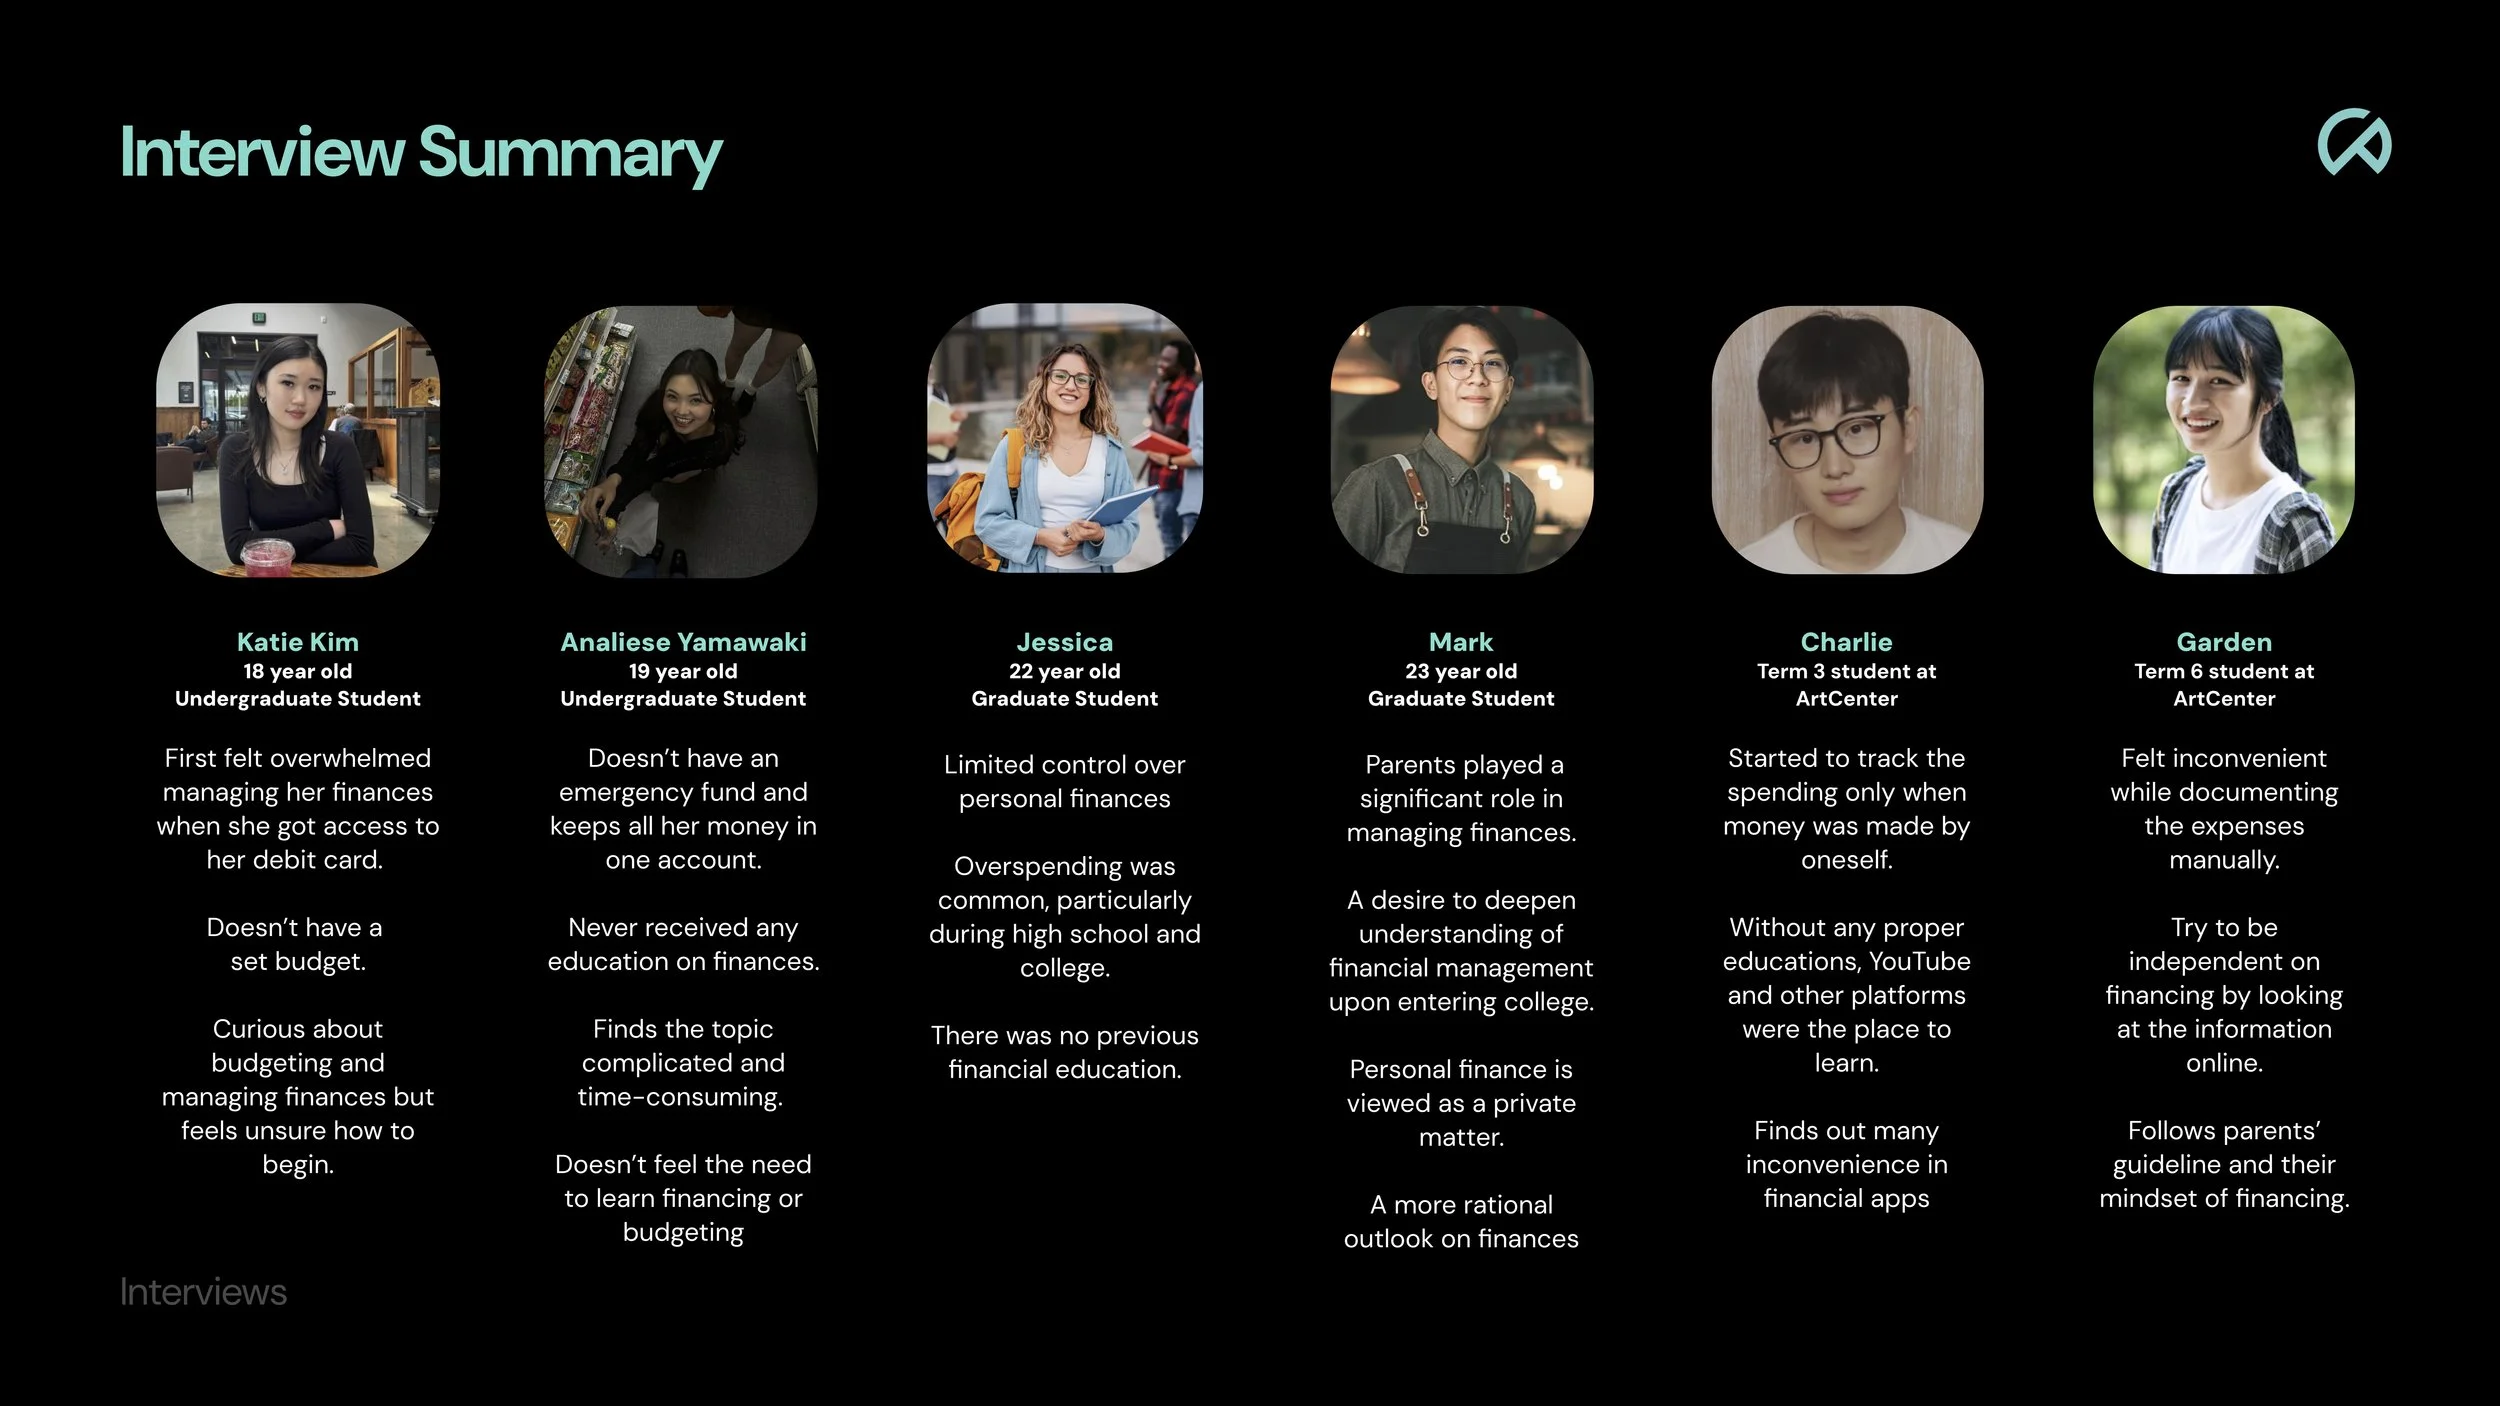
A graphic titled 'Interview Summary' features six individual portraits of young people, each with a brief bio and financial management experiences. The background is black with teal-colored text and headers.

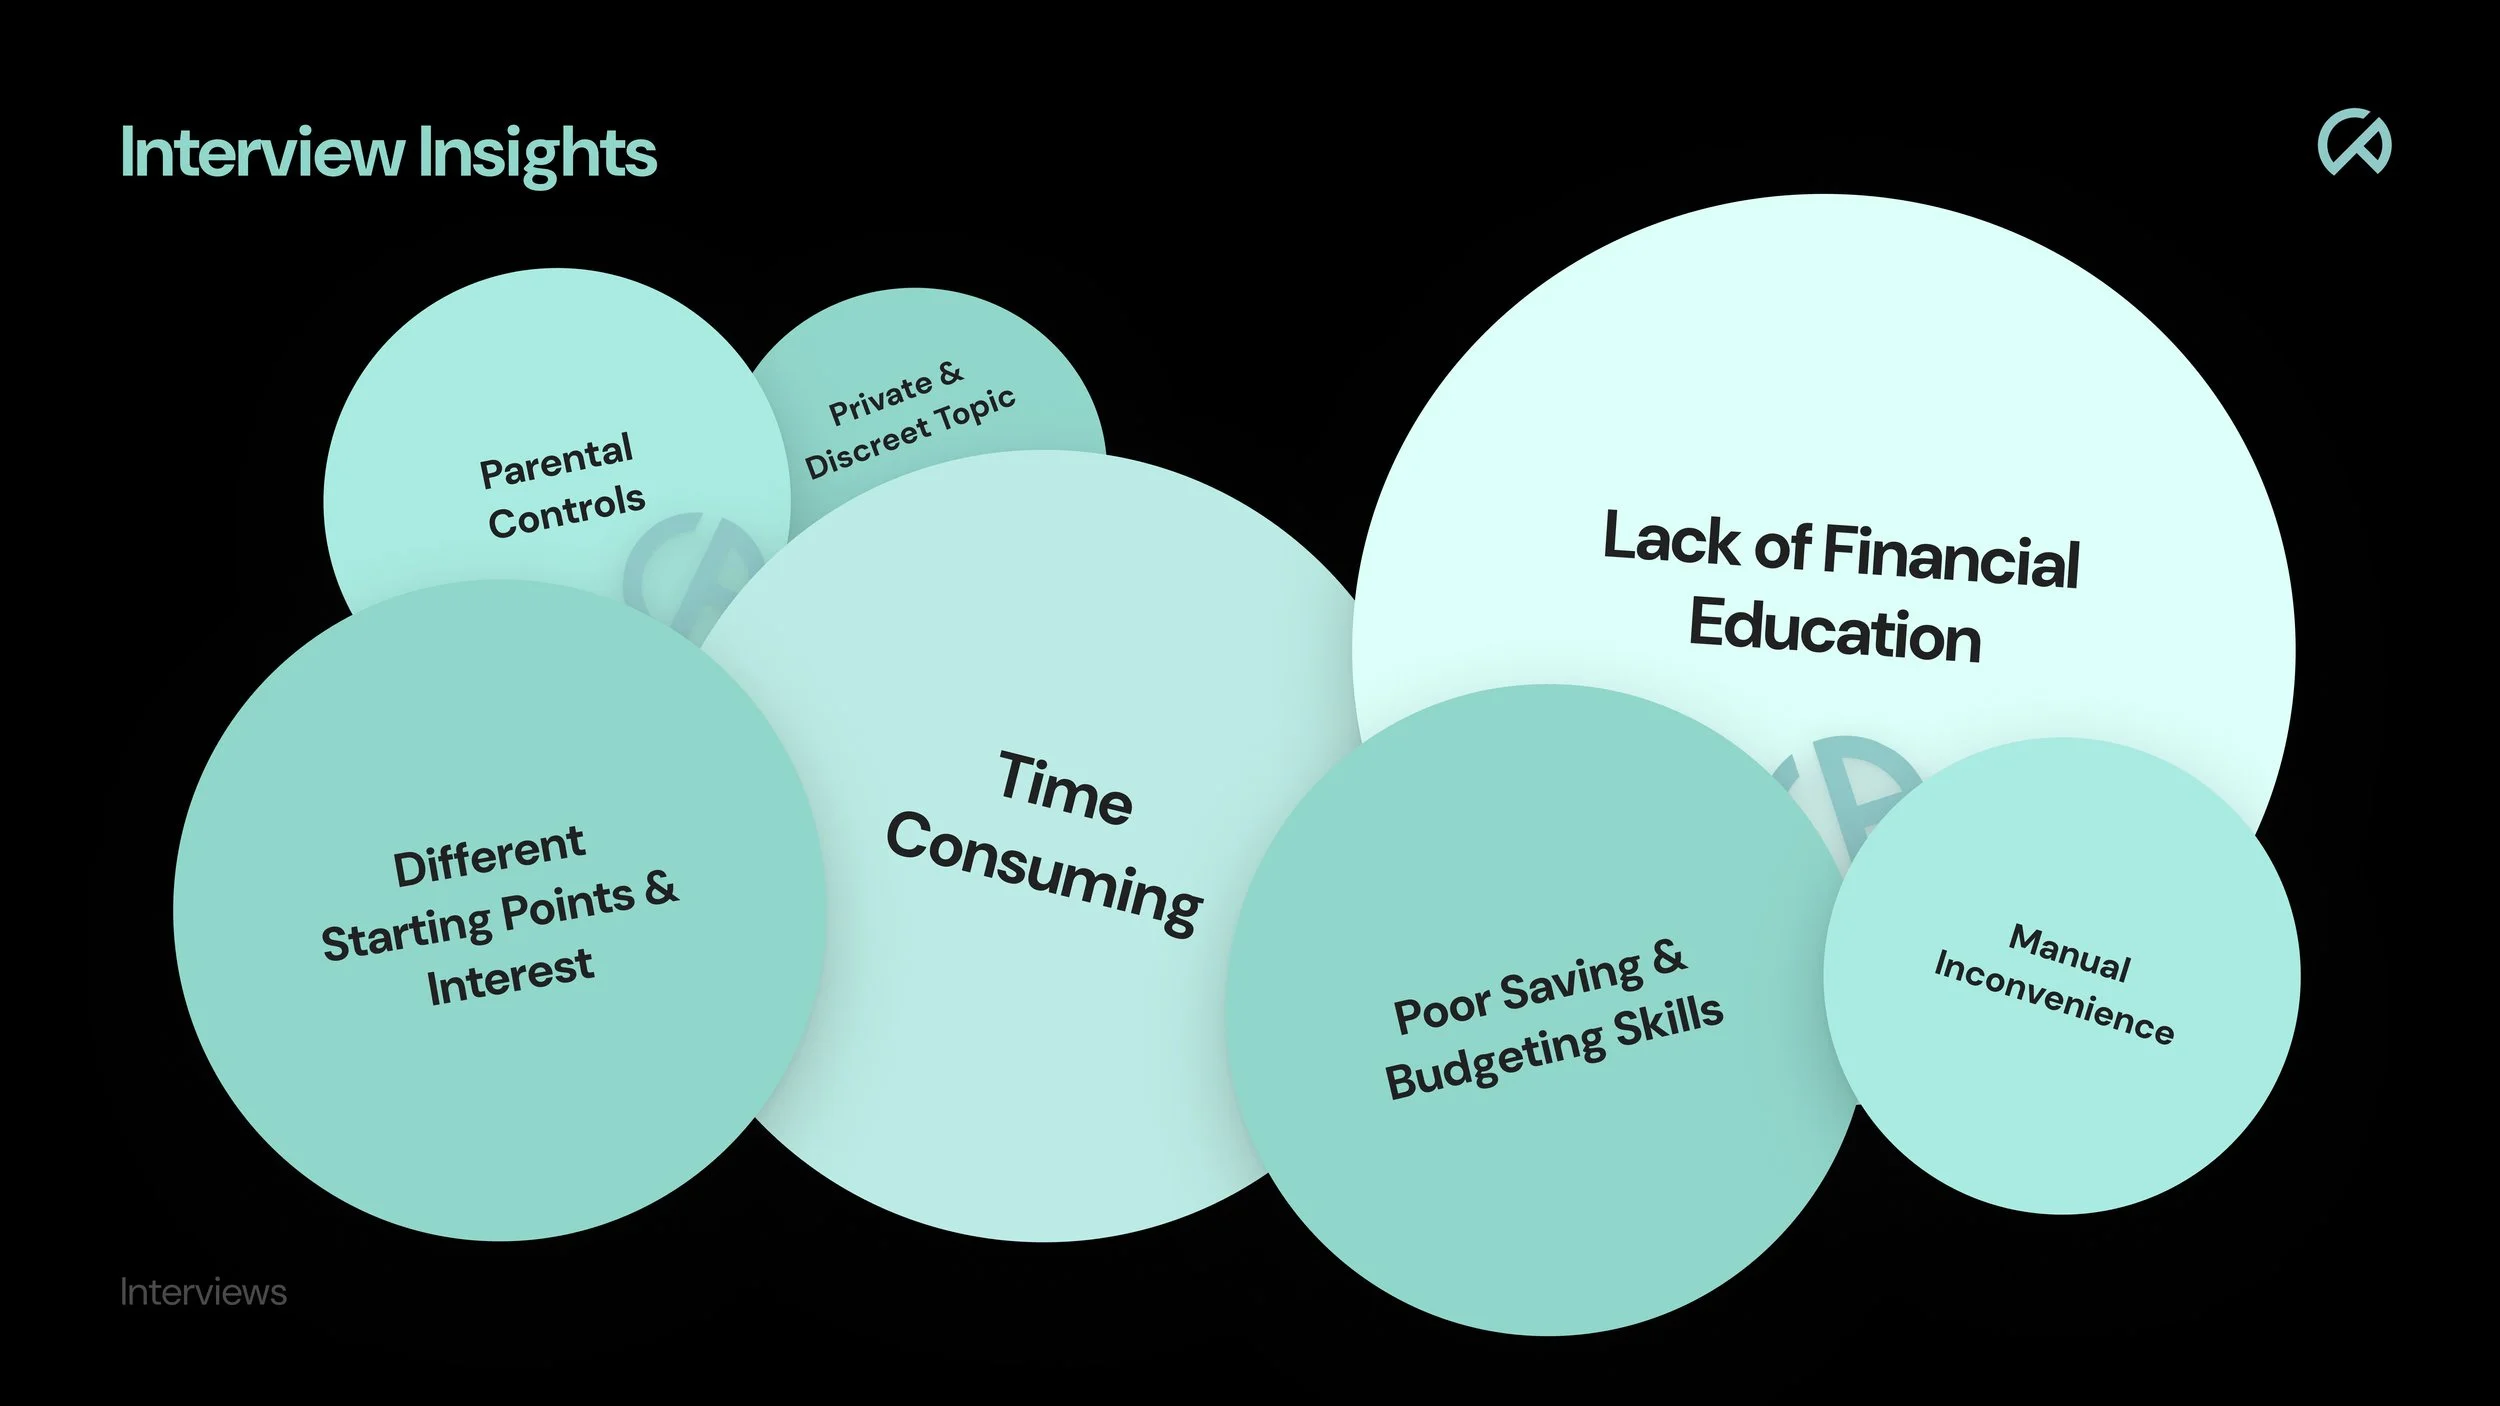
Creating a provisional persona and conducting interviews helped clarify what our target audience needs and the challenges they may face. This research proved and disproved our original ideas.

Ideation
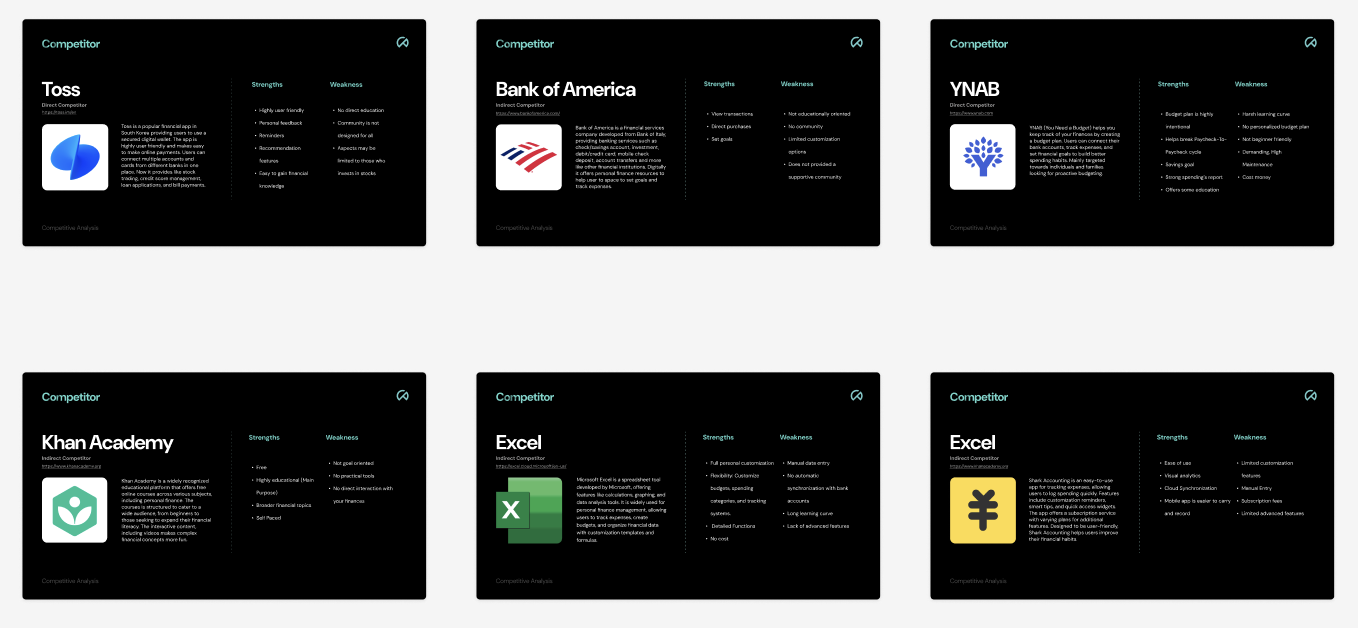
Comparison of six financial service competitor analysis slides. Each slide features a logo, competitor name, strengths, and weaknesses. Competitors include Toss, Bank of America, YNAB, Khan Academy, and Excel.

Comparing potential competitors and assessing their individual features was crucial to our process to find what has been successfully designed.
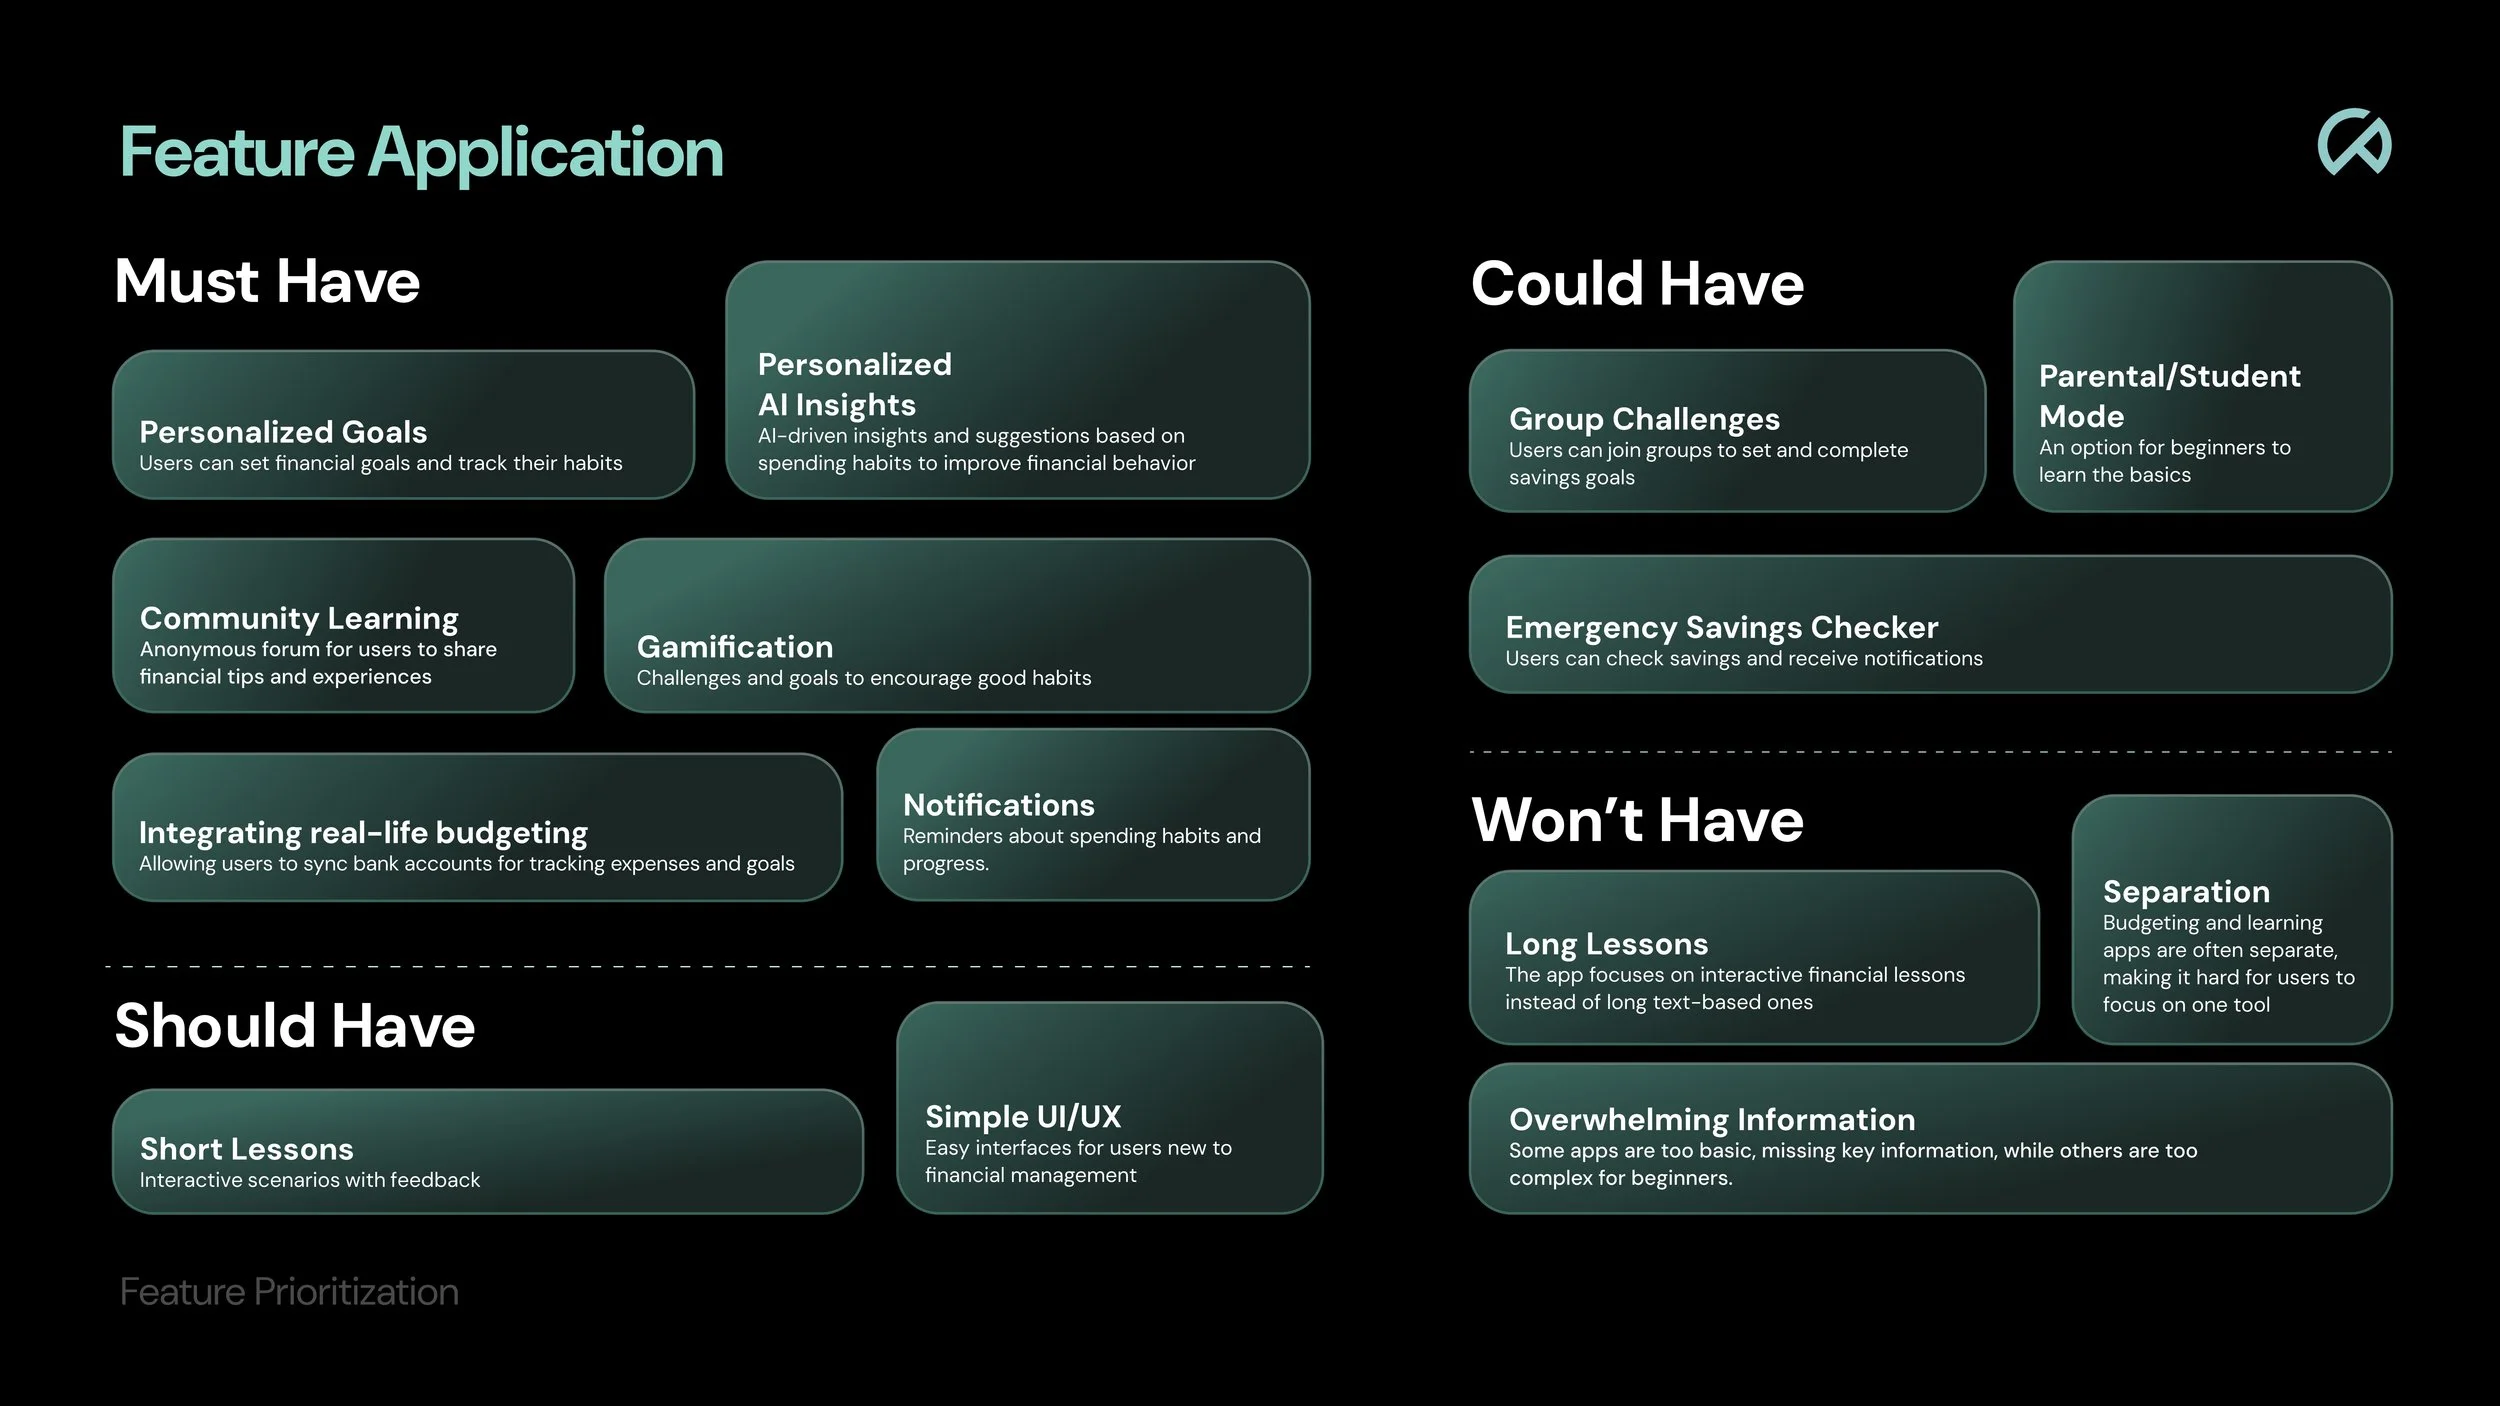
A detailed infographic about feature prioritization for a financial budgeting app, divided into Must Have, Could Have, and Won't Have categories, outlining key features for development.
User Flow
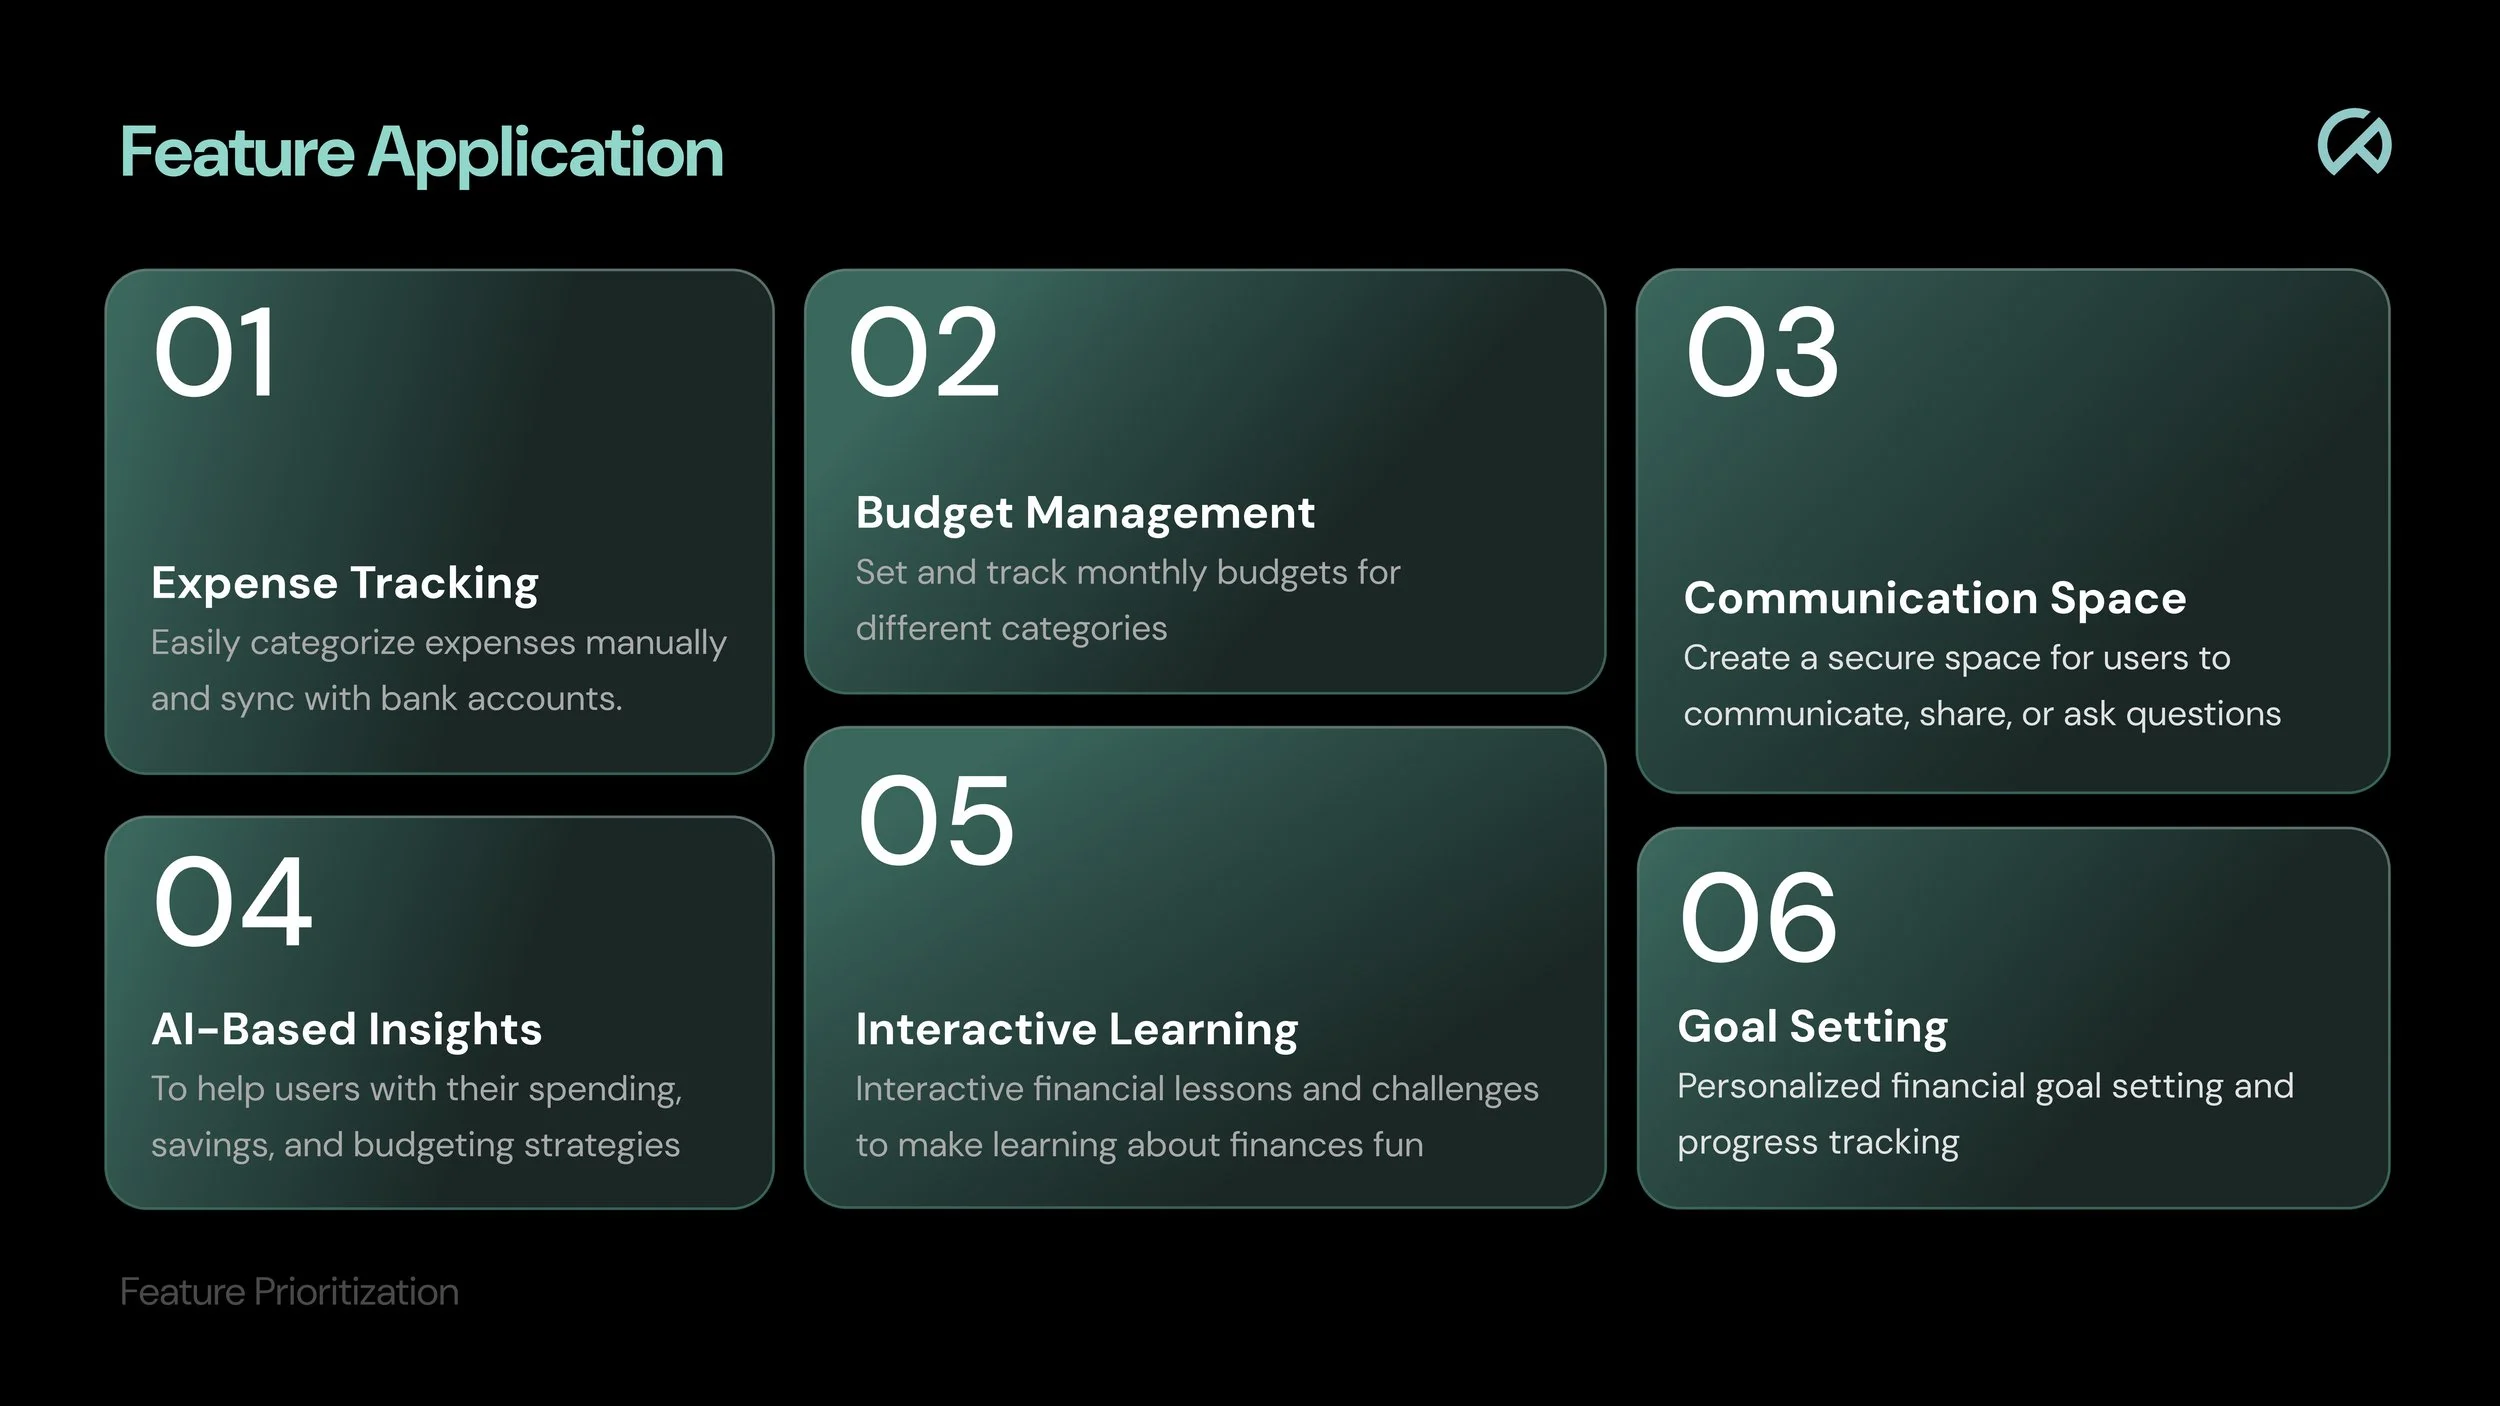
A digital infographic listing six feature applications related to finance. The features include Expense Tracking, Budget Management, Communication Space, AI-Based Insights, Interactive Learning, and Goal Setting, each with a brief description.

Categorizing specific ideas into what would be beneficial to our application allowed us to condense all our ideas to necessary key features which then led to a unique and research based application.
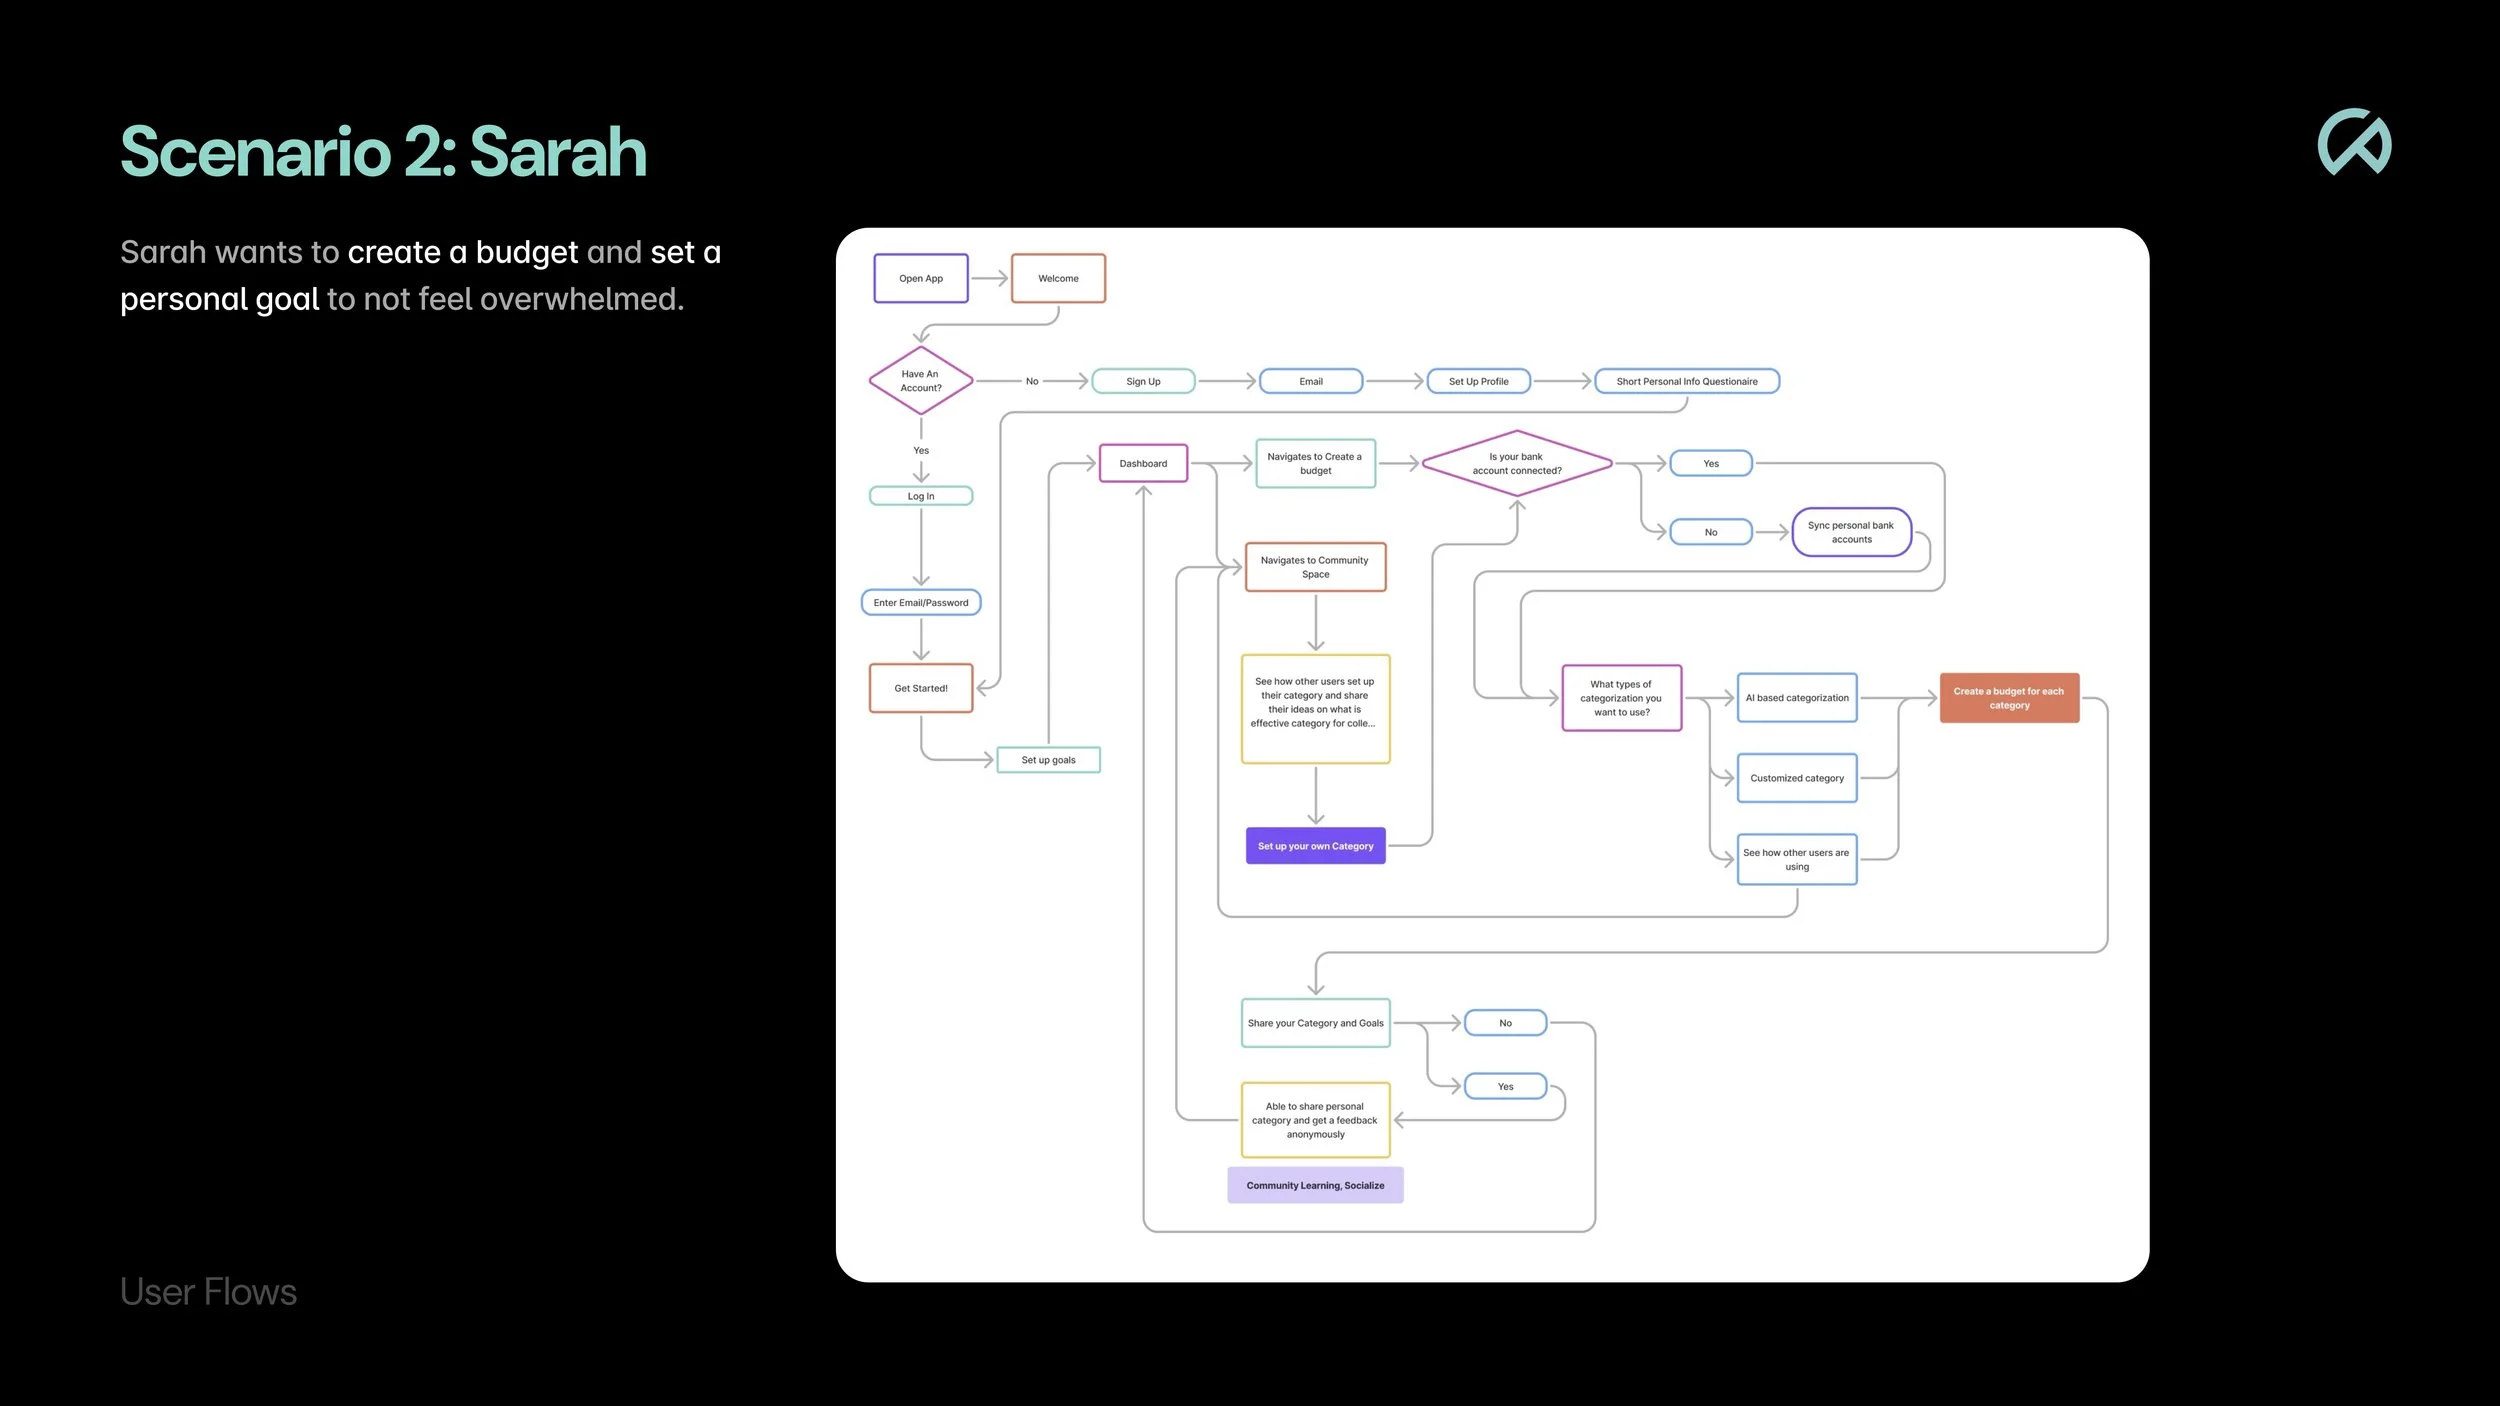
Flowchart titled 'Scenario 2: Sarah' showing steps for creating a budget and setting personal goals, including app opening, signing up or logging in, navigating to create a budget, connecting bank accounts, setting up categories, and community learning.

Mid Fidelity Wireframes

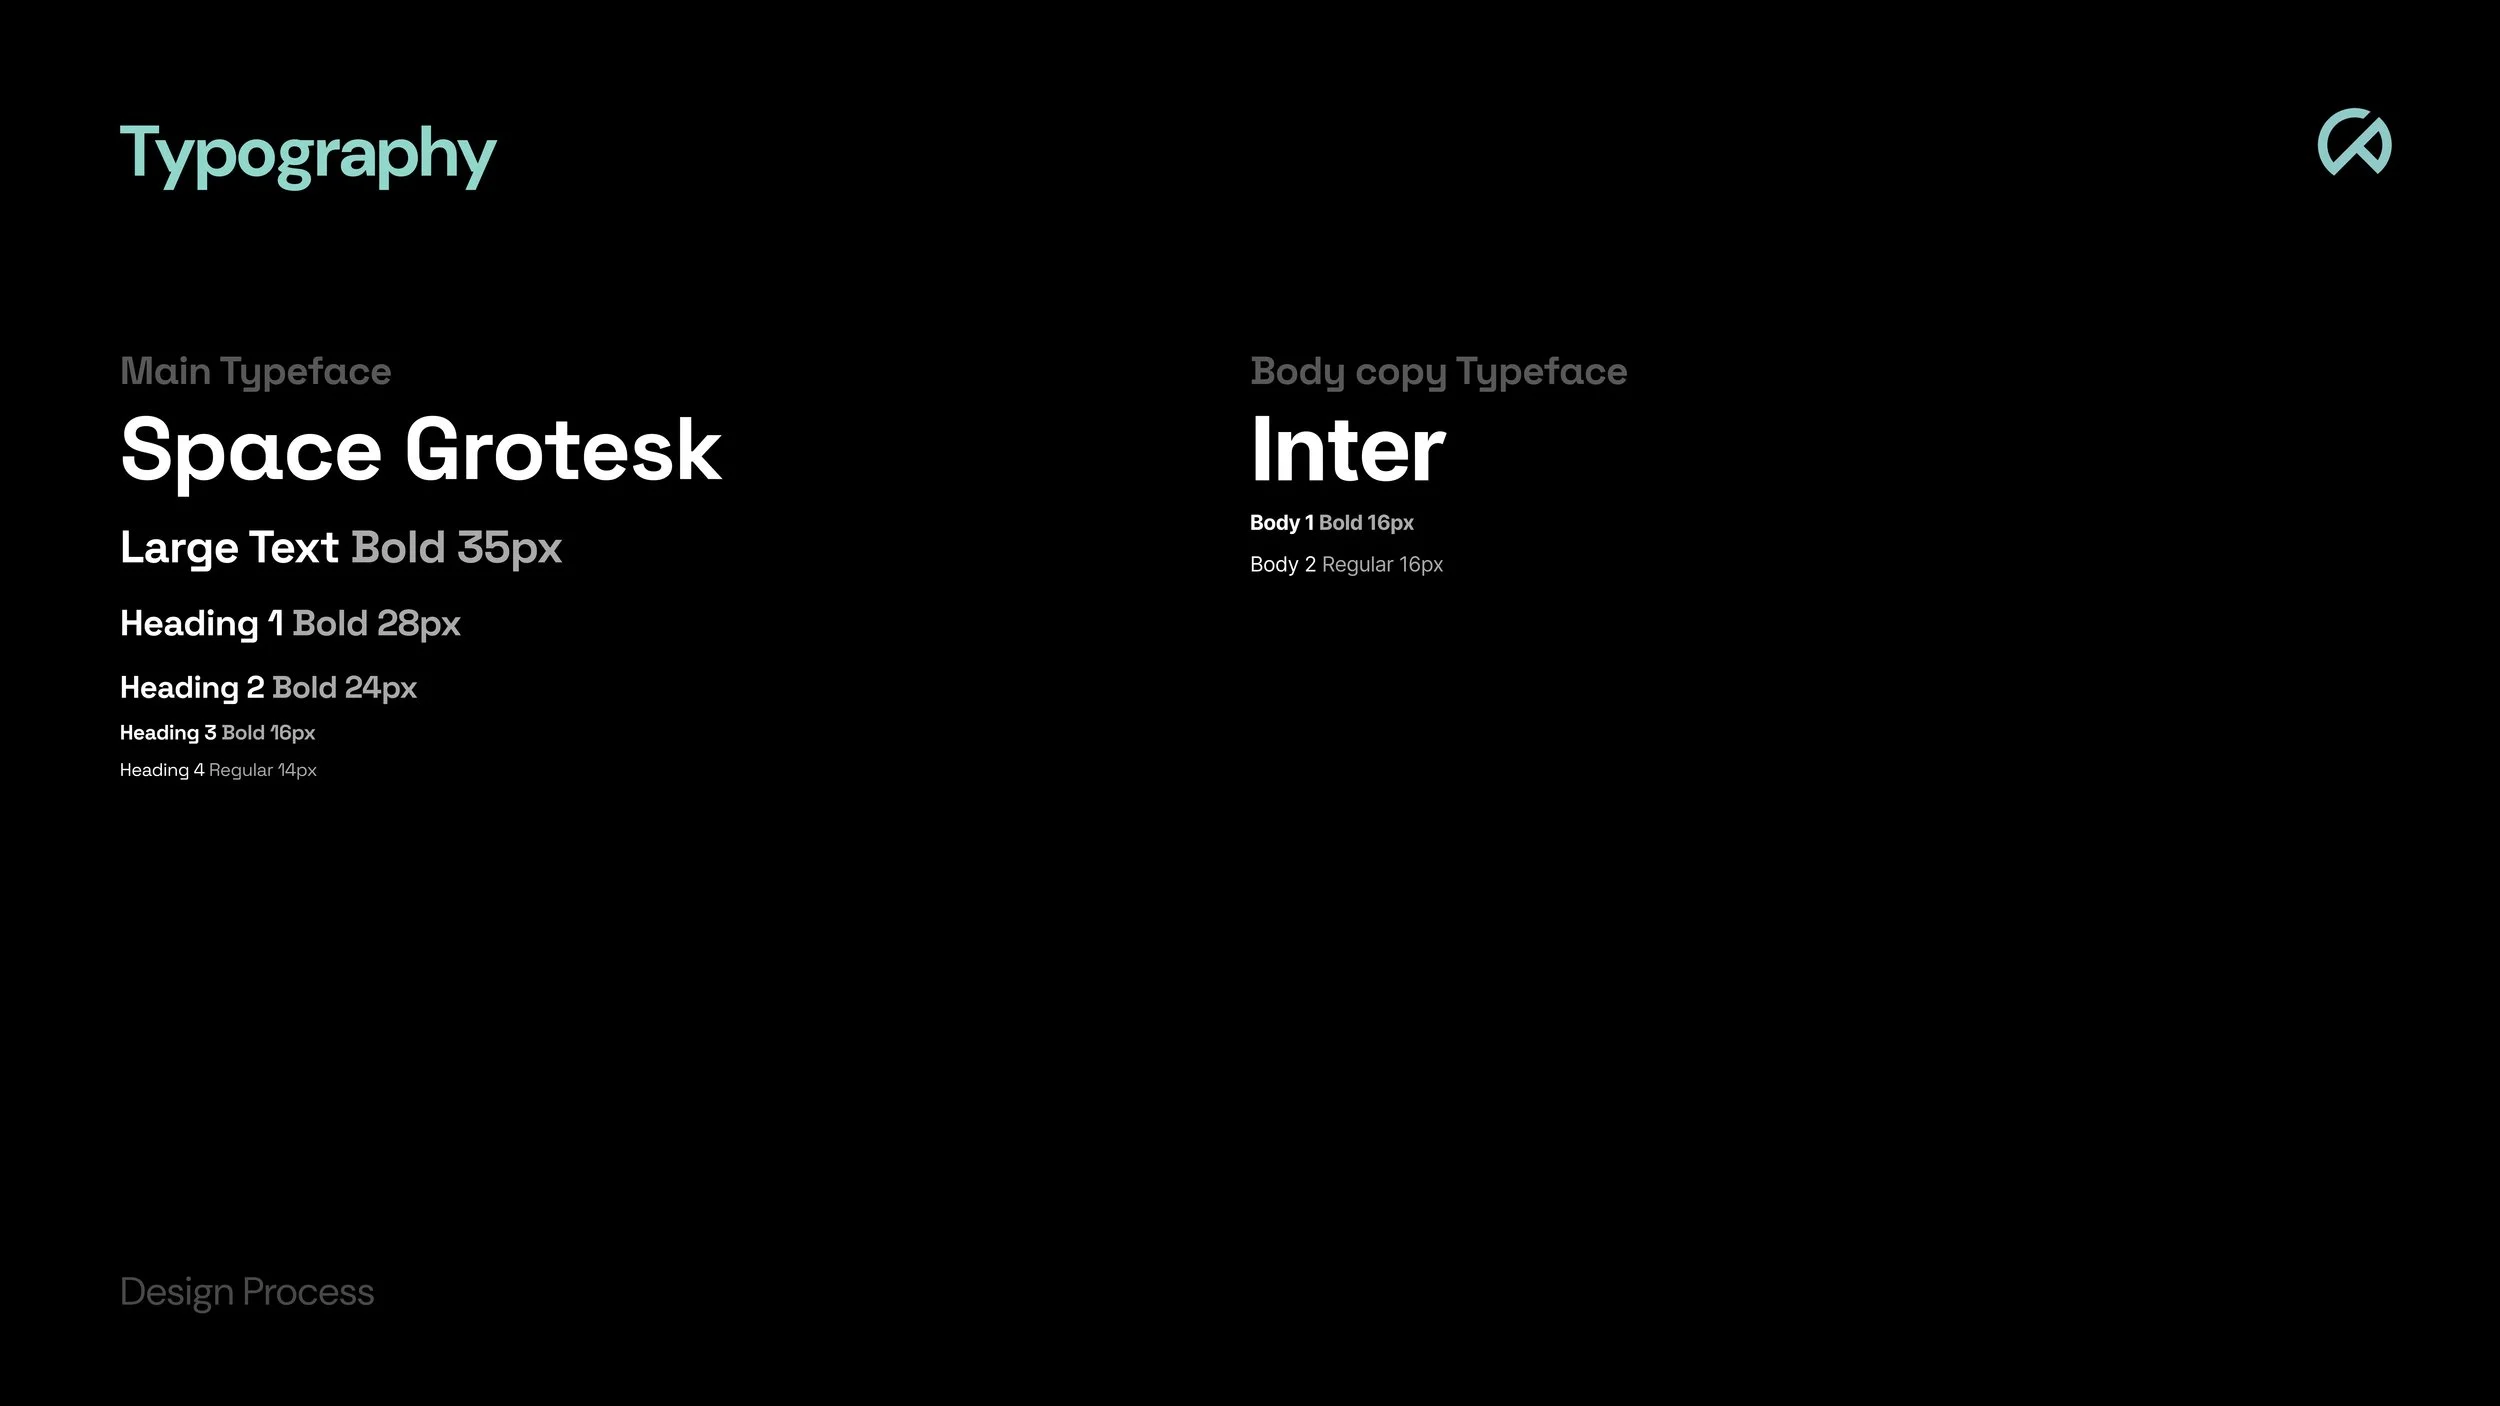
A graphic presentation of typography styles for 'Space Grotesk' and 'Inter' fonts, including various sizes and weights, on a black background.
Flowchart titled 'Scenario 3: Richard' depicting a user journey for managing student loans and finance literacy, with decision points and actions in various colored shapes.
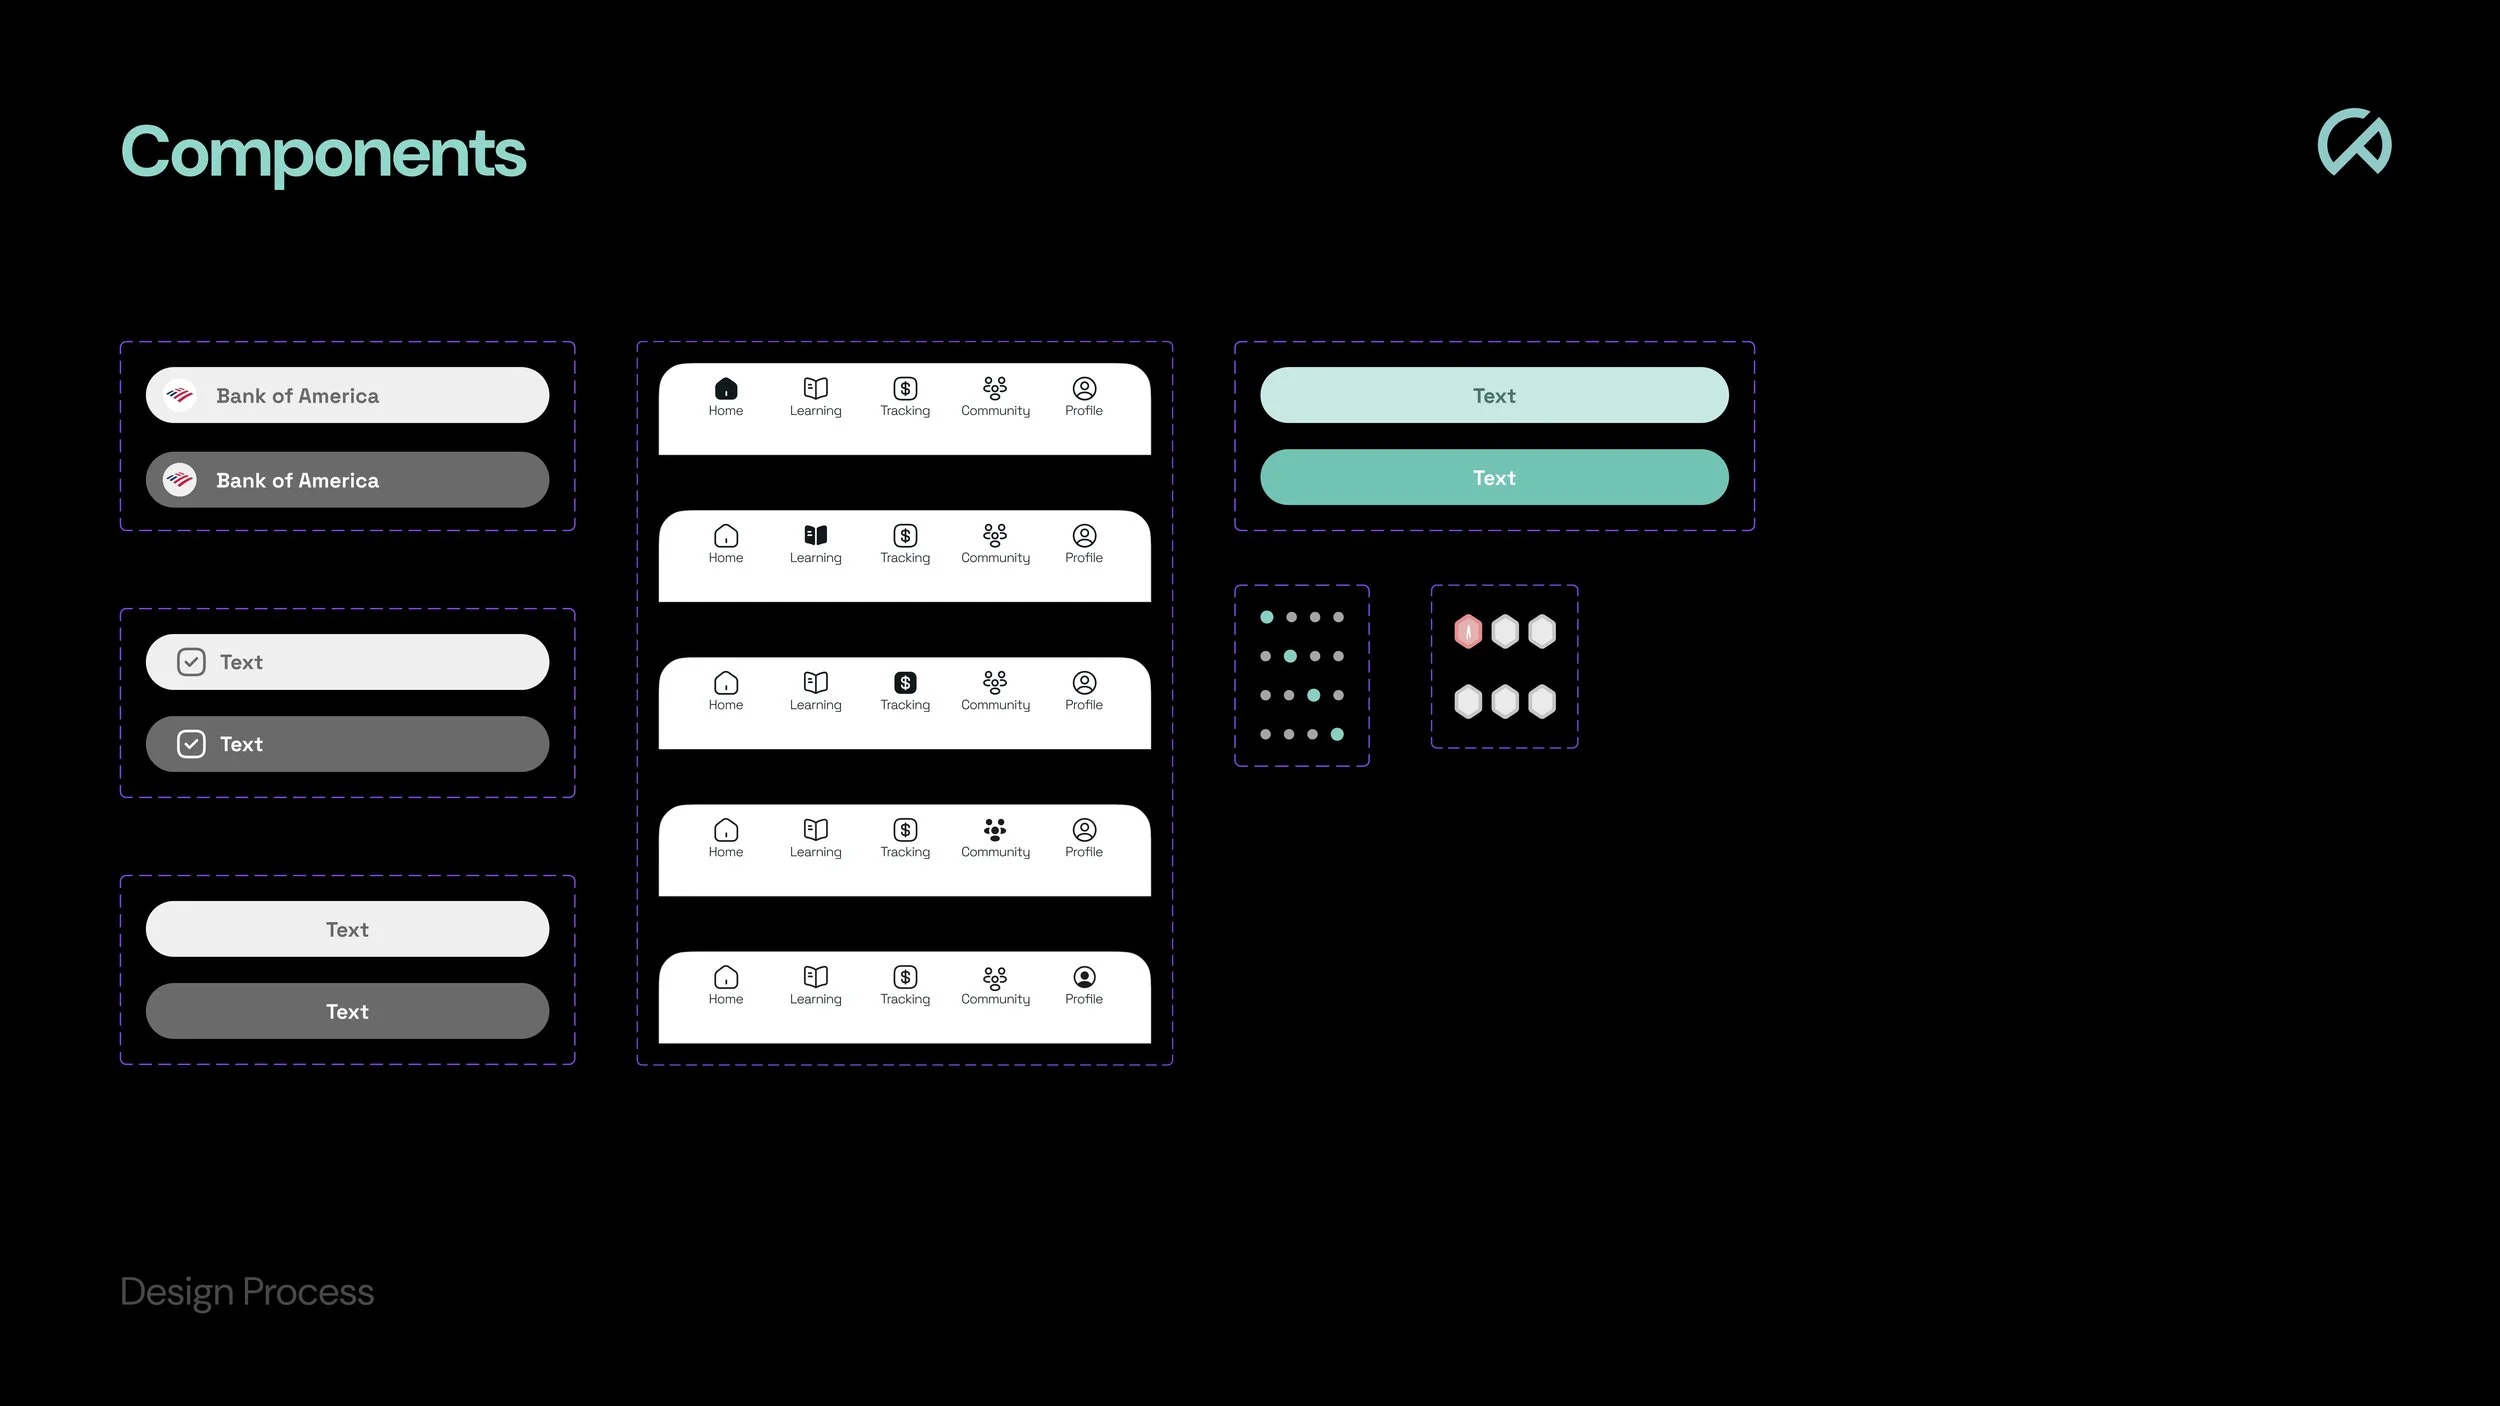
A visual diagram illustrating the design process, with components such as buttons, navigation bars, text fields, icons, and color options arranged on a black background.
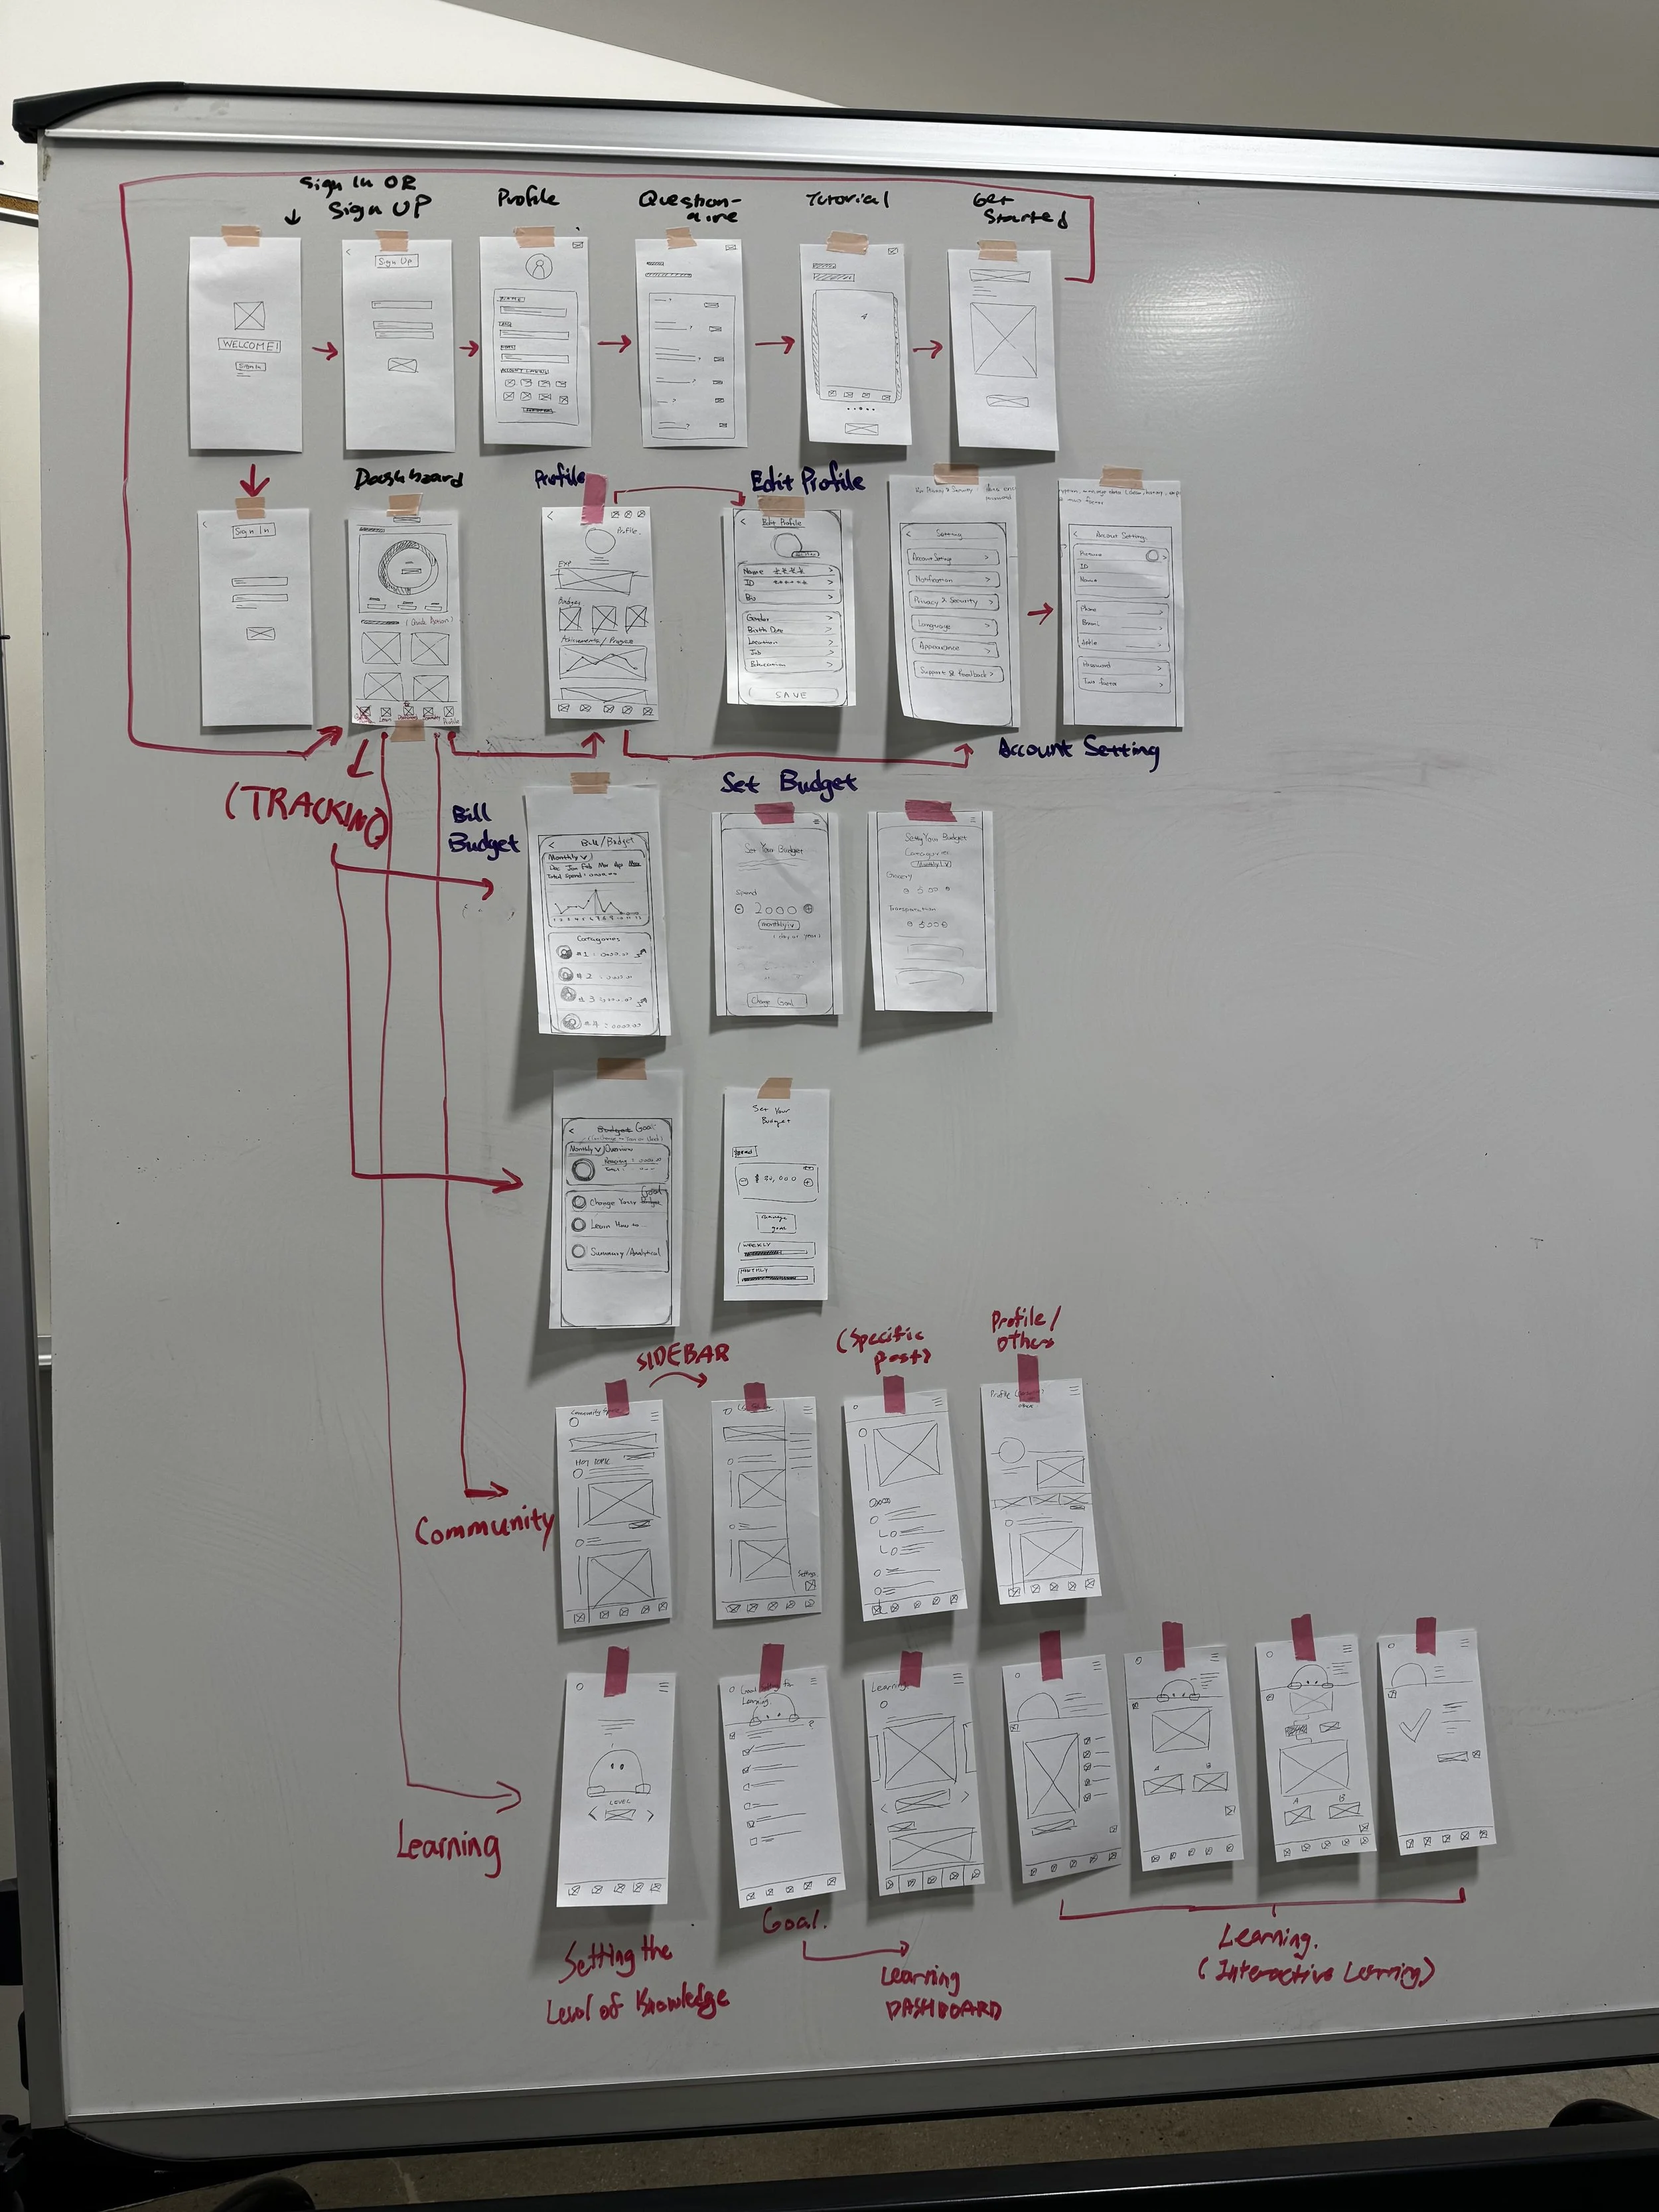
Whiteboard with hand-drawn wireframes and notes outlining the structure of a mobile app. Sections are labeled 'Sign Up,' 'Profile,' 'Questionnaire,' 'Get Started,' 'Dashboard,' 'Account Settings,' 'Set Budget,' 'Community,' and 'Learning.' Red and black handwritten annotations indicate flow and organization of app screens.

Design

Low Fidelity - Thumbnails

A grayscale wireframe of a mobile app or website design process, showing various screens such as sign-in, sign-up, account linking, tutorials, dashboards, profiles, budgeting, savings, and activity tracking.

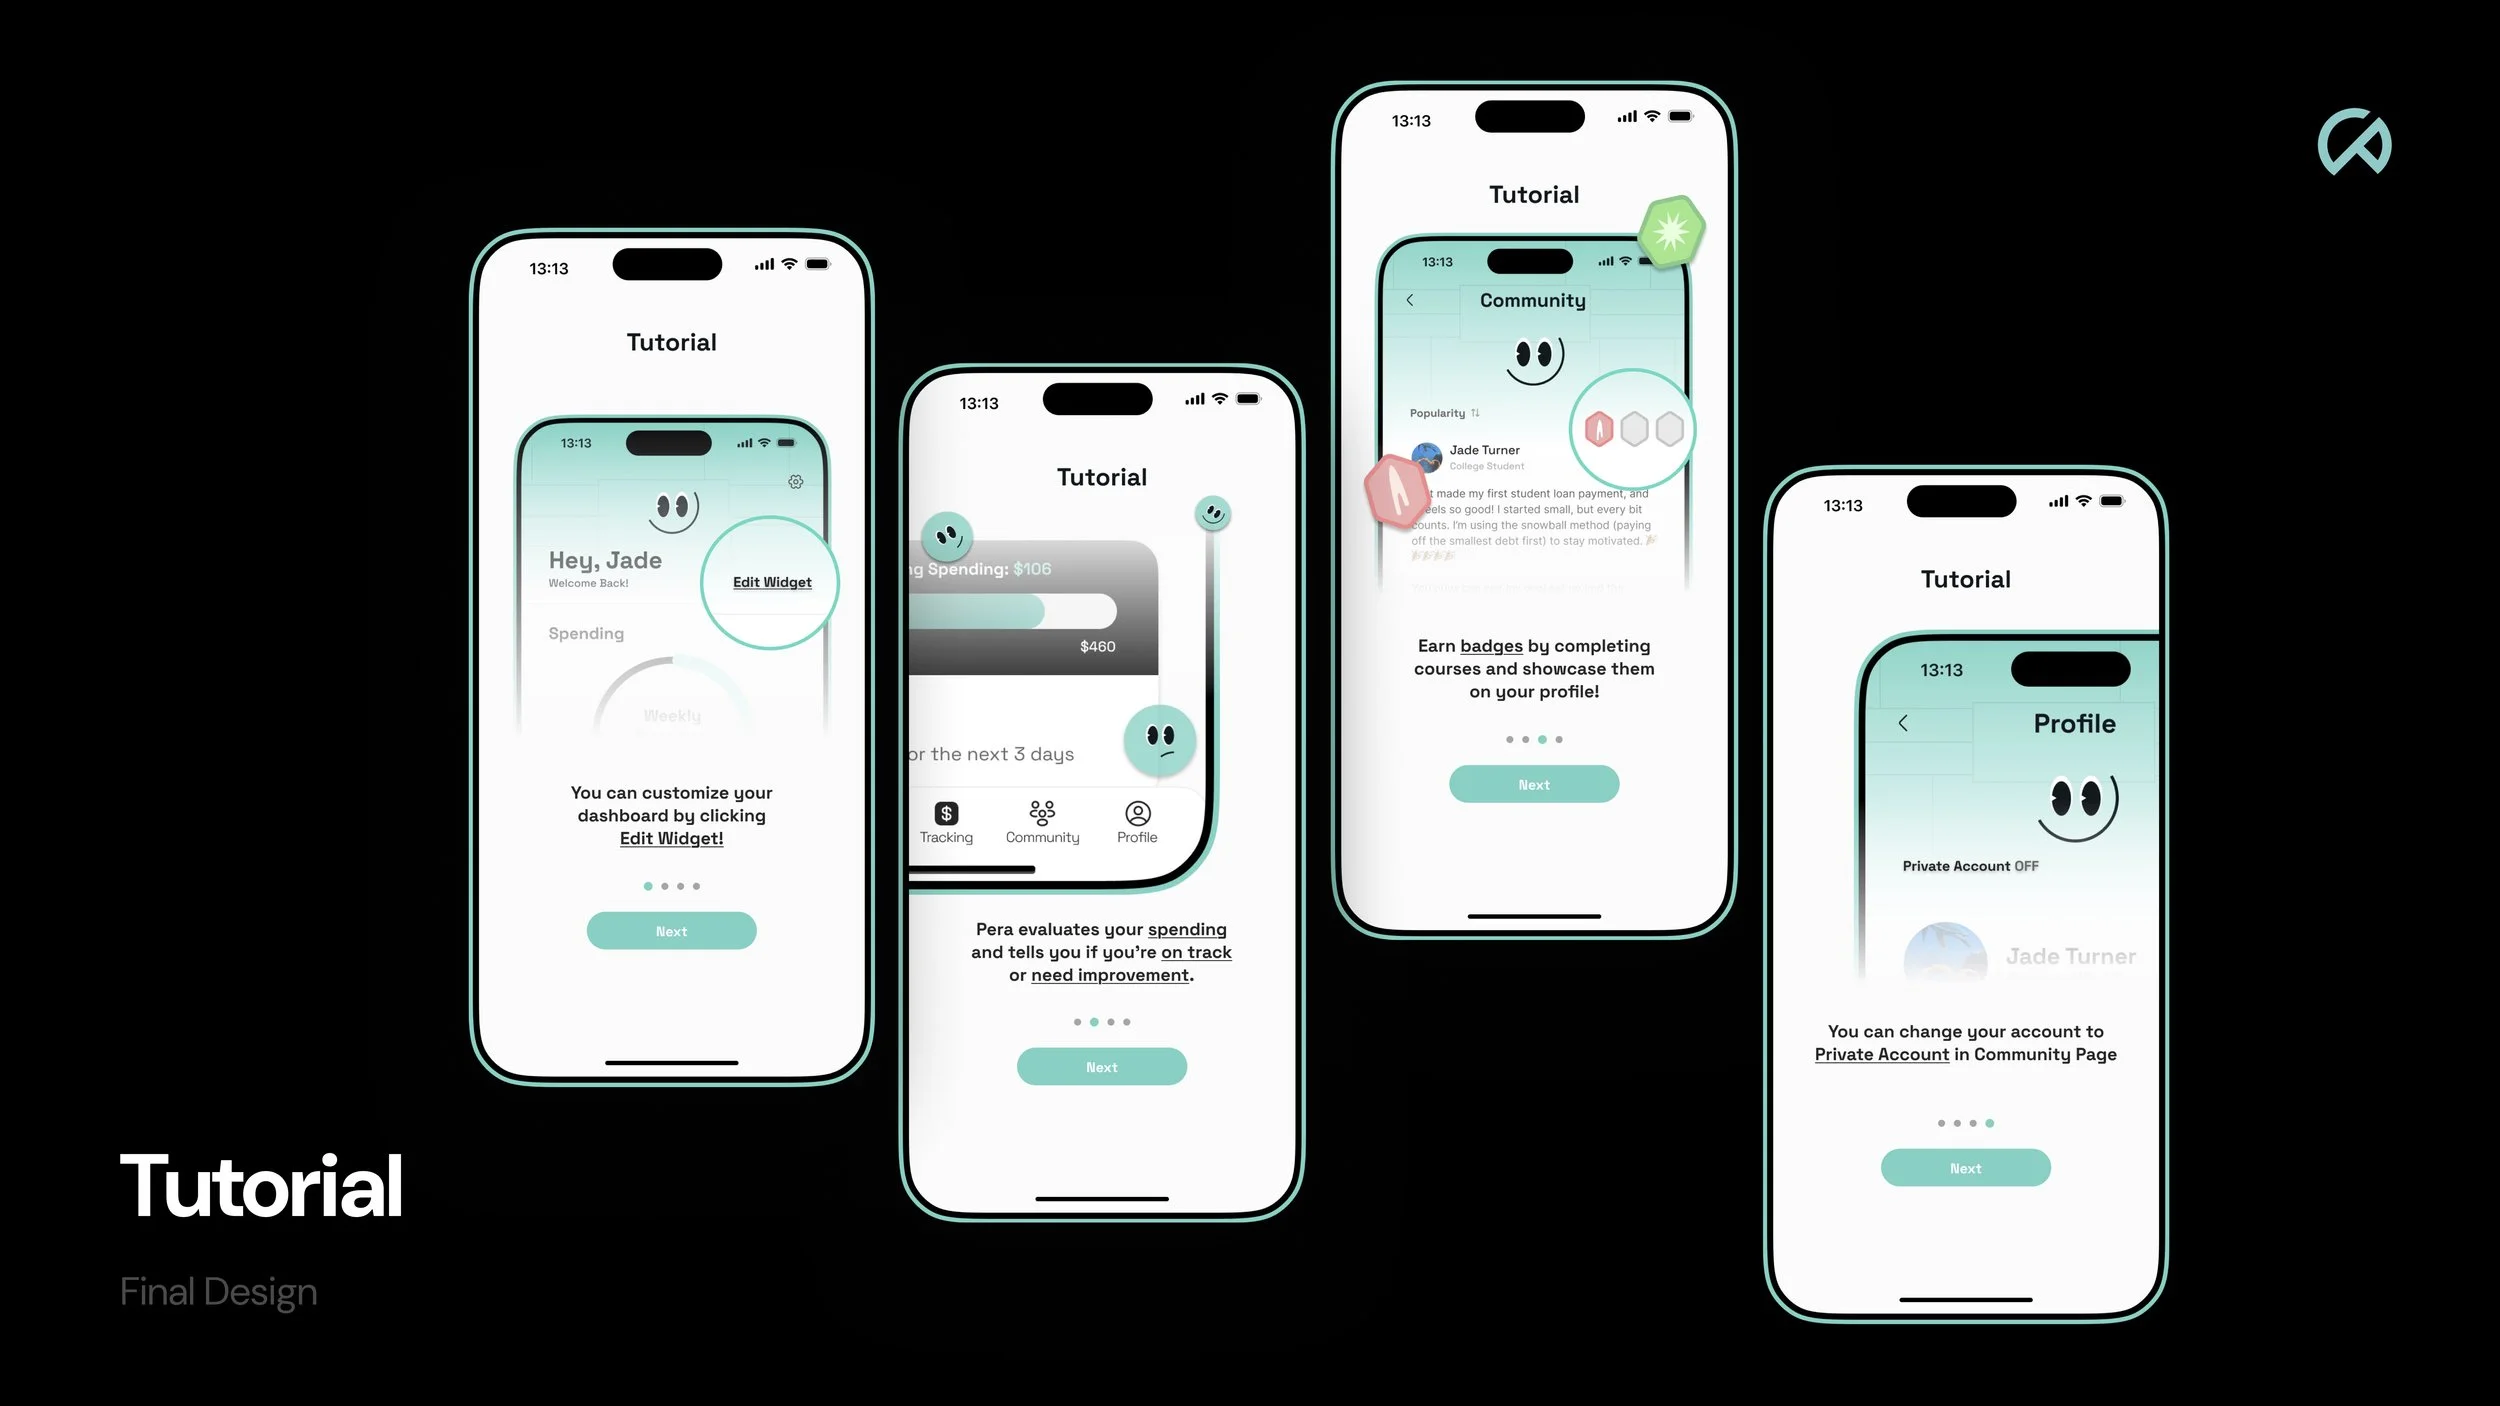
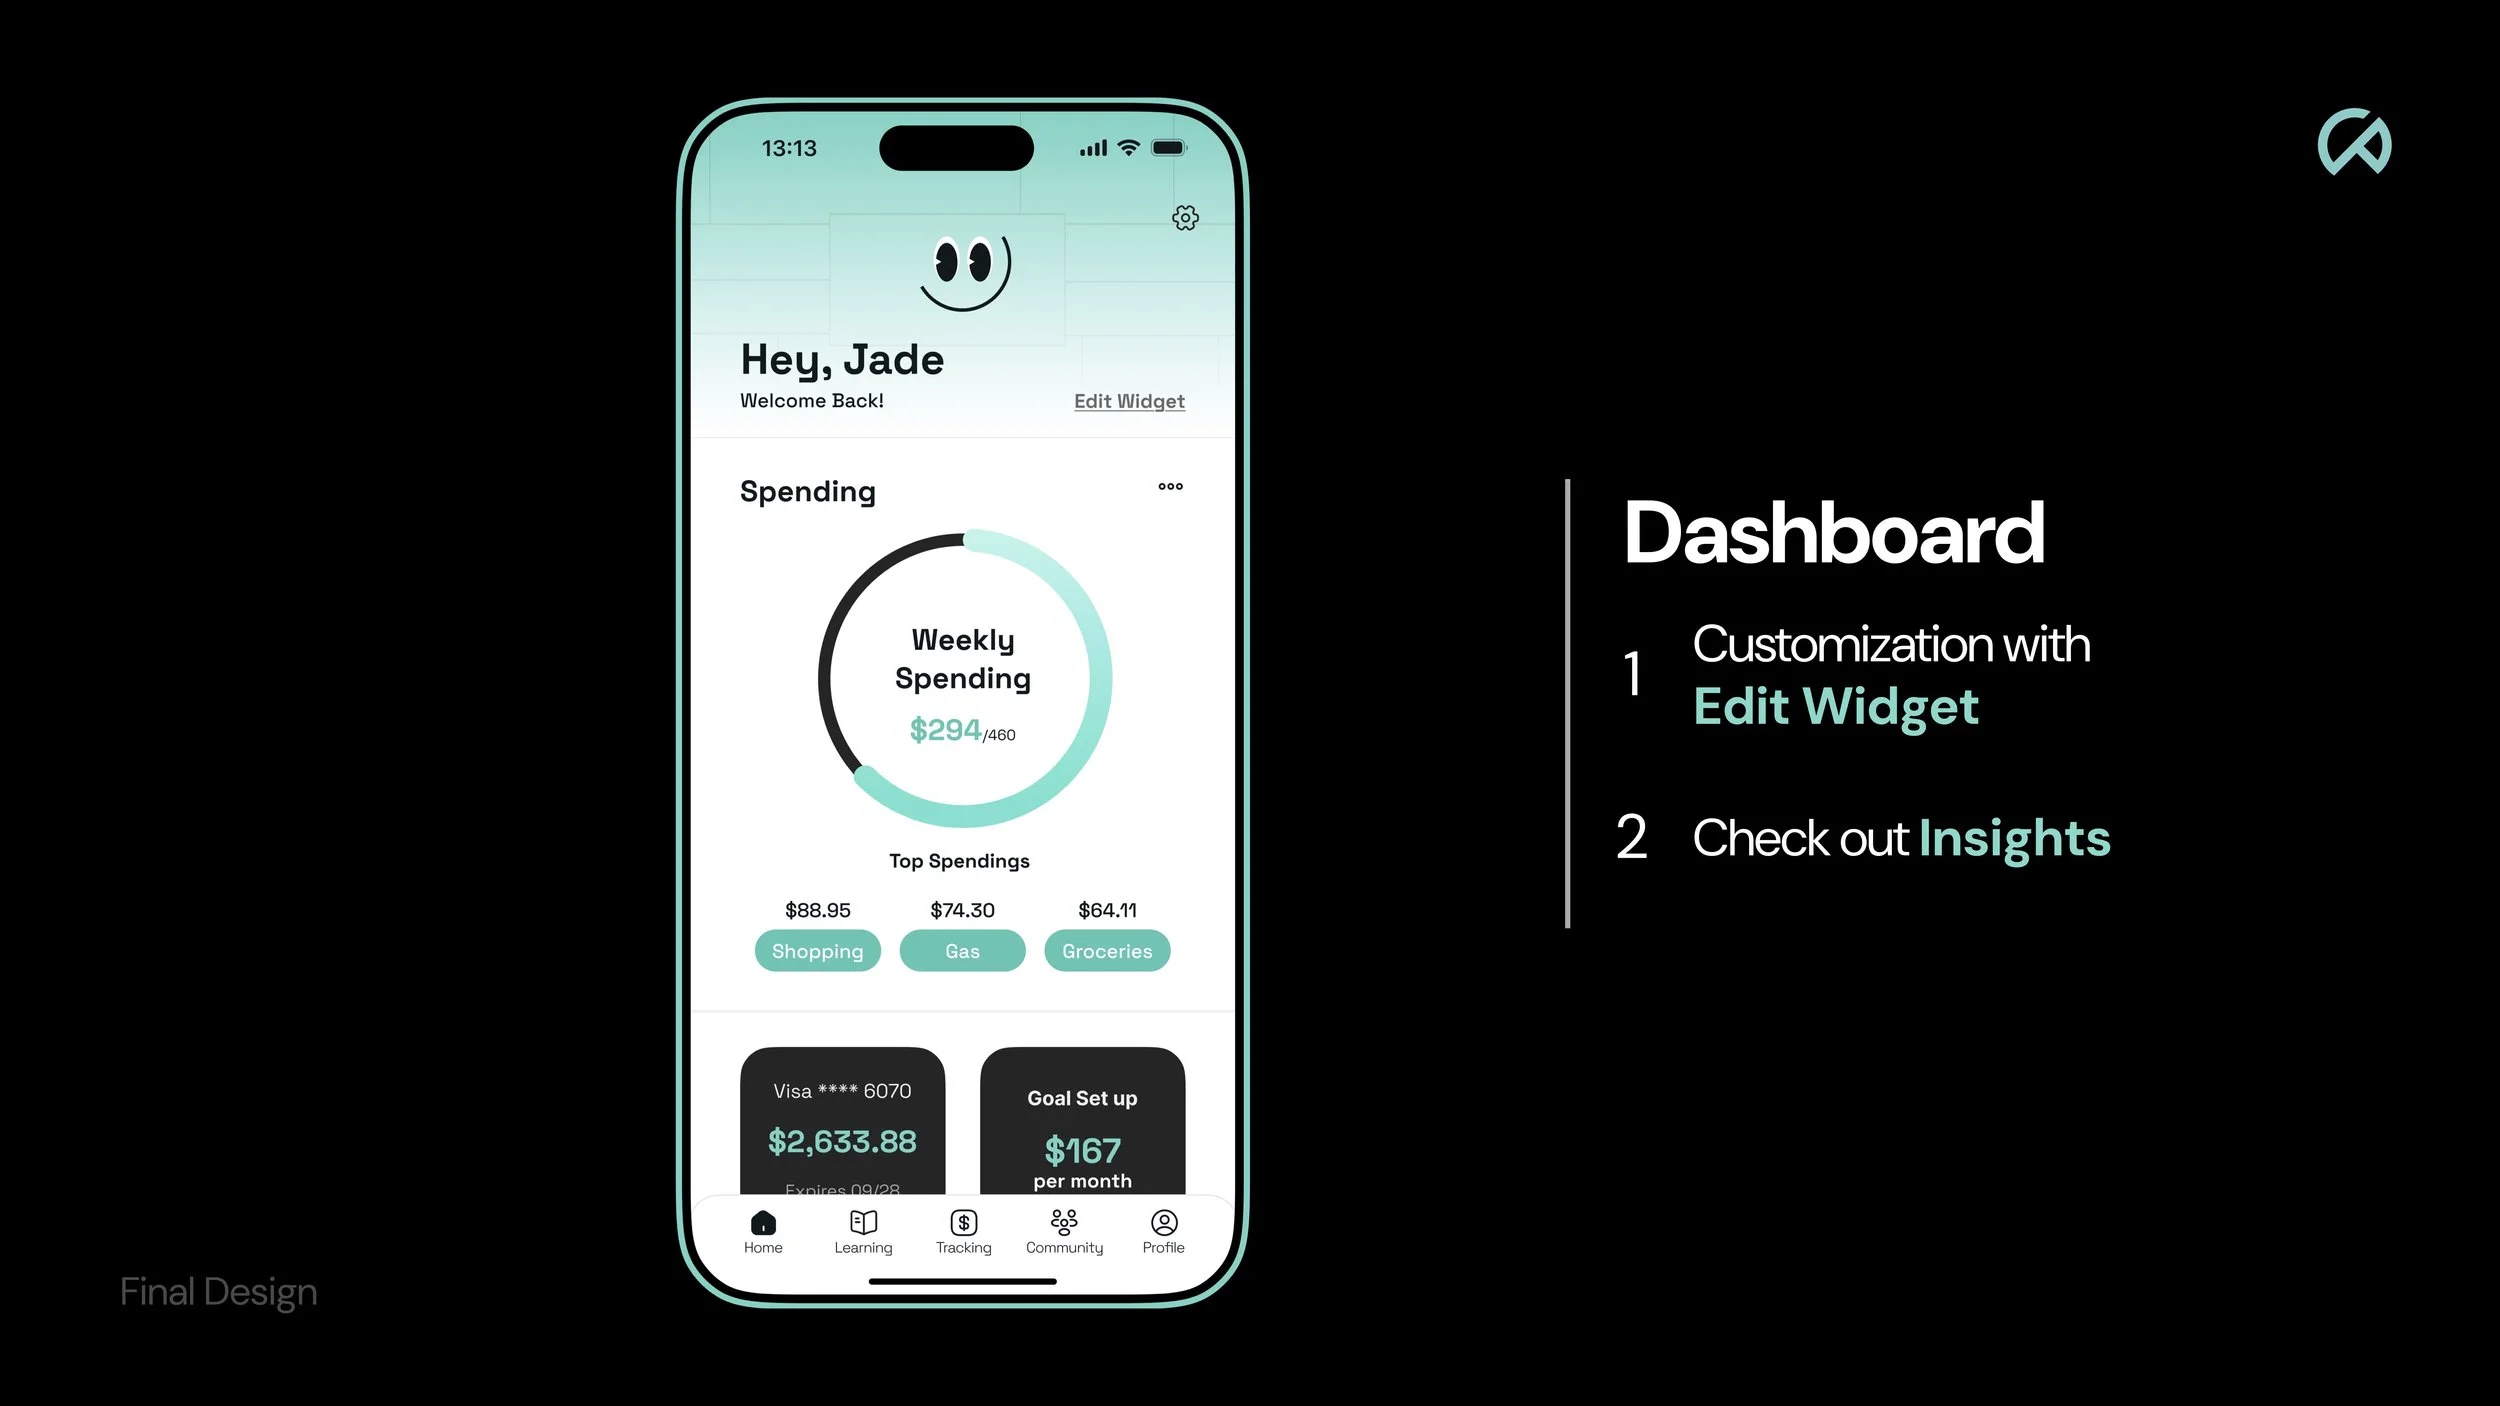
We chose our color palette and typeface, and began creating core components such as buttons, navigation elements, input fields, and layout structures. This helped establish a consistent visual system and design language that supports usability, clarity, and cohesion across the interface.